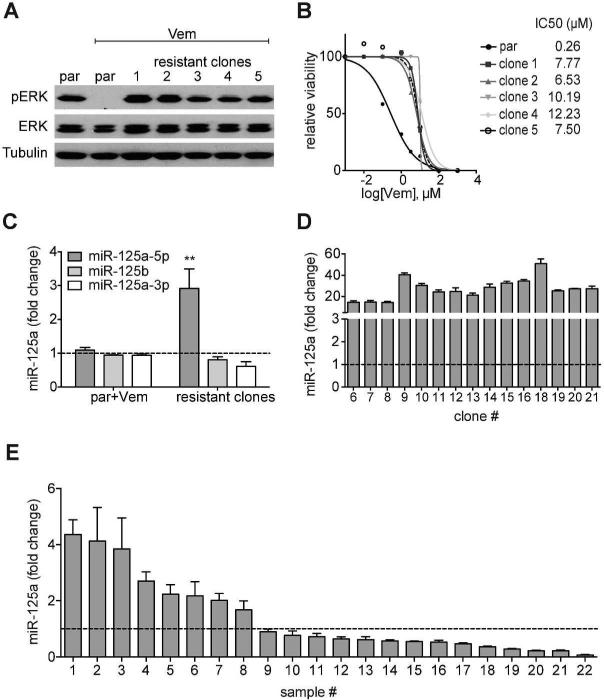
Fig. 1. Increased miR-125a levels in BRAFi resistant melanoma cells and human tissues.
A. Western Blot of pERK (Thr202/Tyr204) and ERK in parental SK-MEL-239 cells (par), parental cells treated with 2μM Vemurafenib for 24h and five resistant clones kept on 1μM Vemurafenib (representative of n=3). B. IC50 curves of SKMEL-239 cells and five resistant clones using increasing amounts of Vemurafenib (0.001μM-100μM) (representative of n=3) C. Average miR-125a-5p, miR-125b and miR125a-3p measurements (normalized to untreated SK-MEL-239 cells (par)), as detected by the nCounter NanoString platform, of parental SK-MEL-239 cells treated with Vemurafenib (n = 2) or resistant clones (n = 5 independent clones). Error bars represent standard deviation of biological replicates. Statistical analysis performed by Student's T test. D. Fold change of miR-125a-5p expression (by RT-qPCR) in a panel of additional SK-MEL-239-derived resistant clones (n = 16) compared to untreated parental SK-MEL-239 cells. Error bars represent standard deviation of technical replicates. E. Fold change of miR-125a-5p (by RT-qPCR) in 22 human melanoma tissue samples post-Vemurafenib treatment compared to their respective paired pre-treated sample (dotted line).

