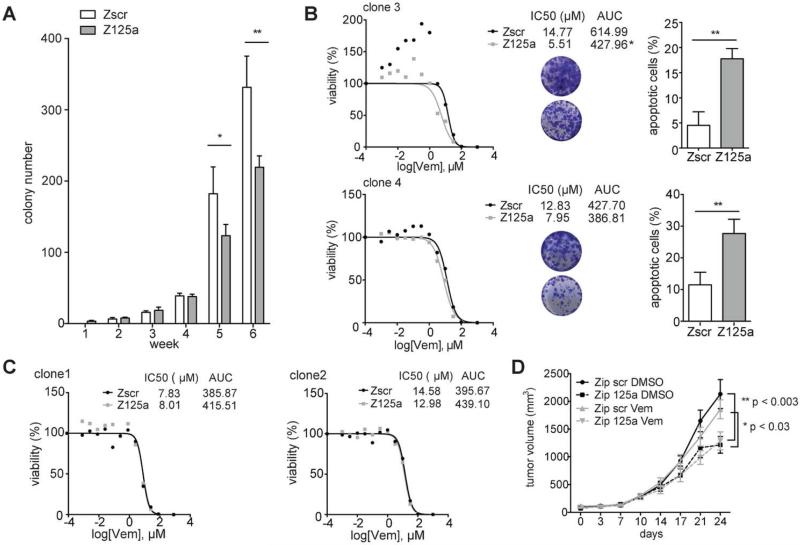
Fig. 3. Inhibition of miR-125a suppresses emergence of resistance and partially restores BRAFi sensitivity of some resistant clones.
A. Number of colonies formed by SK-MEL-239 cells transduced with Zip scr and Zip 125a constructs and treated with 2μM Vemurafenib for 6 weeks (average of quintuplicates). B. Viability curves of resistant clones transduced with Zip scr and Zip 125a and treated with increasing Vemurafenib concentrations (0.001μM-100μM) for 4 days (left panel). Tables indicate IC50 value and area under the curve (AUC). Photo inserts of crystal violet staining of Zip scr (upper circle) or Zip 125a (lower circle) transduced resistant clones after 8 days (clone 4) or 10 days (clone 3) of treatment with 2μM Vemurafenib. Apoptosis detected through FACS analysis of AnnexinV/PI staining after 8 days (clone 4) or 10 days (clone 3) in Zip scr and Zip 125a resistant clones treated with DMSO or 2μM Vemurafenib (right panel). C. Viability curves of resistant clones transduced with Zip scr and Zip 125a and treated with increasing Vemurafenib concentrations for 4 days. D. Tumor growth curves mock- (DMSO) or vemurafenib-treated (vem) BRAFi-resistant SK-MEL-239 clone transduced with Zip scr or Zip 125a. For every assay in A-C, a representative experiment of a triplicate is shown along with SD. AUC: area under the curve, clone3: p≤0.05, clone 4, 1, 2: n.s. *P≤0.05, **P<0.001.

