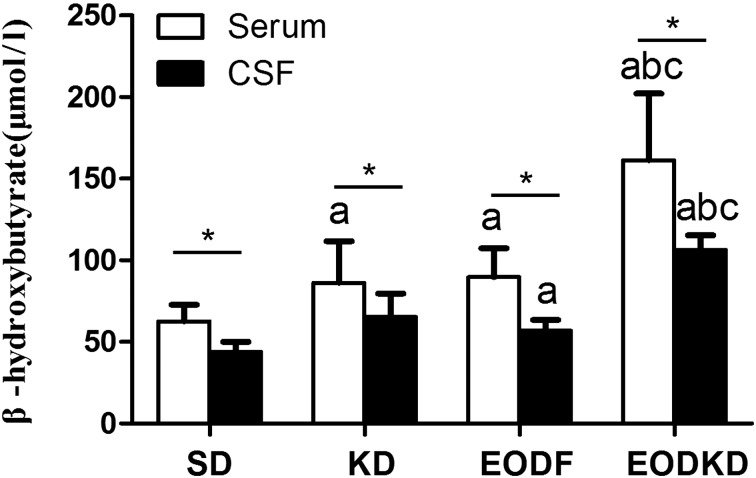
Fig. 2.
Concentrations of β-hydroxybutyrate in serum and cerebrospinal fluid of rats fed the SD, KD, EODF diet and EODKD. The letters a, b, and c indicate the SD, KD, and EODF groups, respectively. Means marked with letters (a, b, c) are significantly different (P<0.05). An asterisk indicates a significant difference between the serum and CSF (P<0.05). There were six rats in each group. Differences among groups were tested using Kruskal-Wallis ANOVA and the Mann-Whitney U test, while differences within groups were tested using the Wilcoxon Matched Pairs test.

