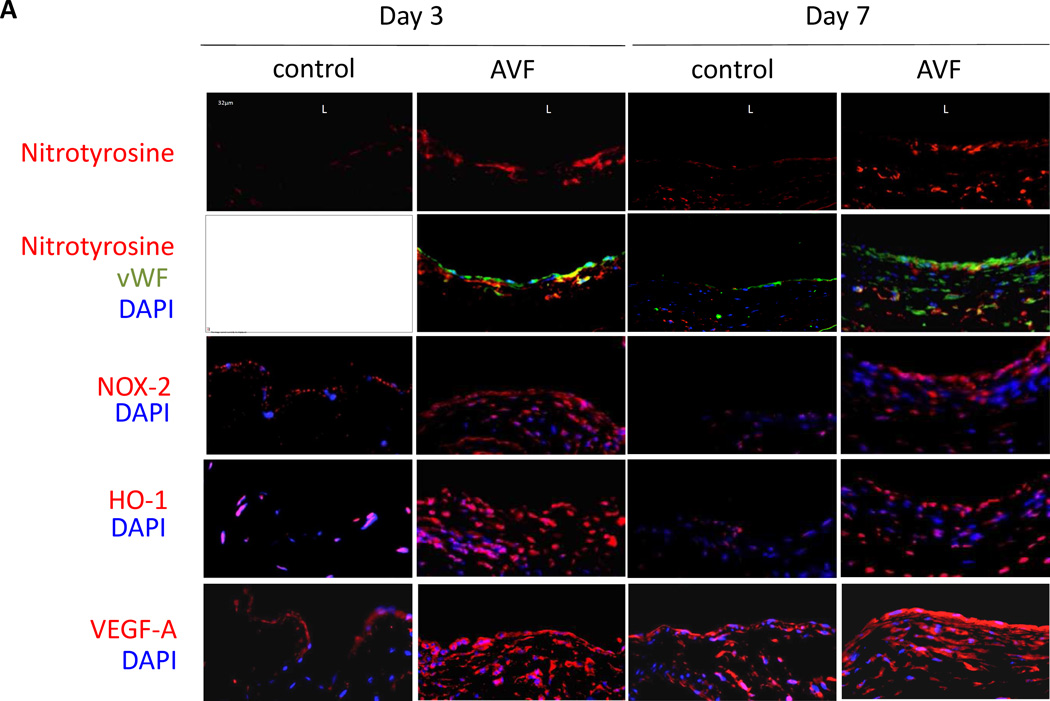
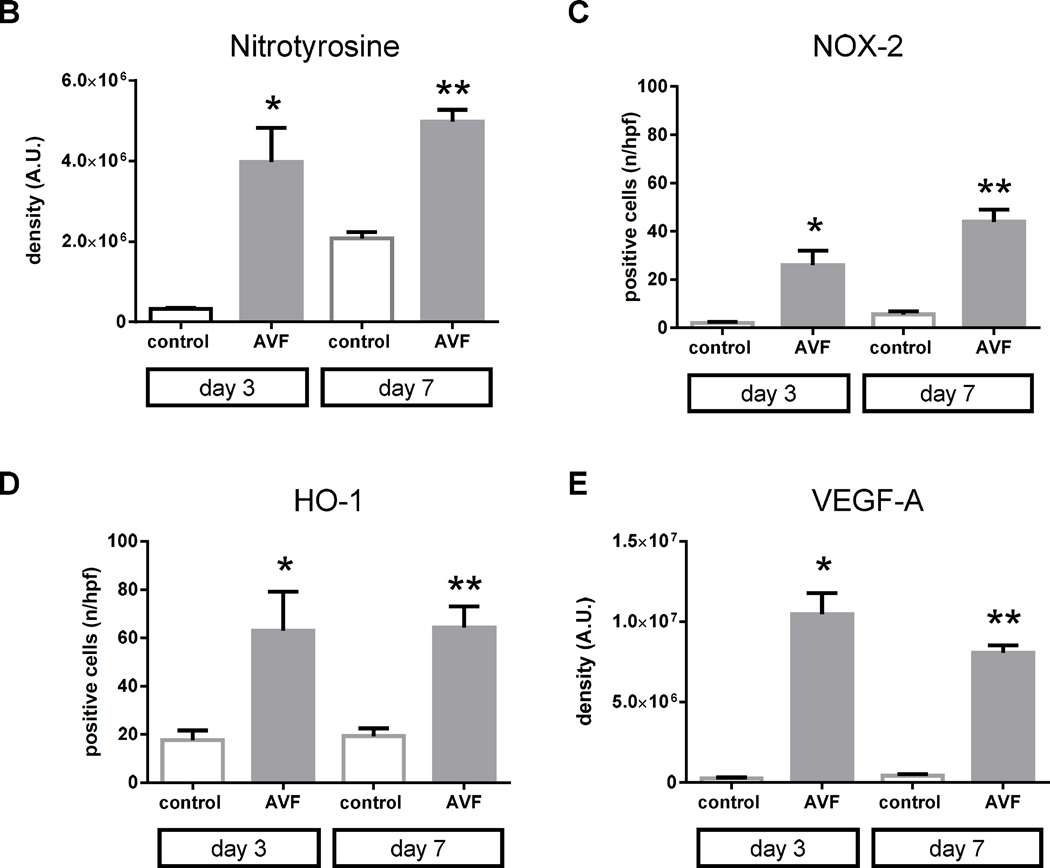
Figure 2.
Oxidative stress pathway during AVF maturation. A) Representative immunofluorescence showing nitrotyrosine (upper 2 rows), NOX-2 (third row), HO-1 (fourth row) and VEGF-A (bottom row) in sham vein and AVF, matched at postoperative days 3 and 7. L, Luminal side of the vein. Scale bar, 32µm; magnification, ×40. B) Bar graph shows quantification of nitrotyrosine immunofluorescence intensity. *, p = 0.0123; **, p = 0.001. n=3. C) Bar graph shows number of cells positive for NOX-2. *, p = 0.0166; **, p = 0.0018. n=3. D) Bar graph shows number of cells positive for HO-1. *, p = 0.0091; **, p = 0.0011. n=3. E) Bar graph shows quantification of VEGF-A immunofluorescence intensity. *, p = 0.0015; **, p < 0.0001. n=3. A.U., arbitrary units.


