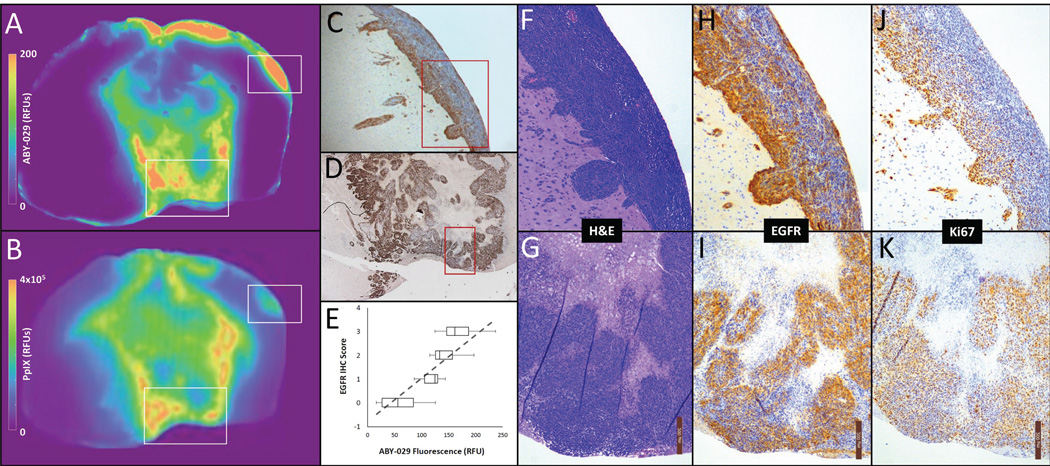
Figure 4.
(A) A color map representation of the ABY-029 fluorescence signal and (B) PpIX fluorescence signal in an F98EGFR tumor. Strong spatial agreement between ABY-029 fluorescence and EGFR-stained IHC images were observed in the tumor core (D) and at distant regions of tumor invasion (C). This pattern similarity is observed across all animals: quantitatively, the variation in intensity showed good agreement with IHC EGFR score by regression analysis (η = 0.84, p < 0.001) (E). For the regions within C and D indicated by red squares, higher power micrographs (10×) show the H&E stained morphology (F and G), IHC stain for EGFR (H and I) and the IHC stain for Ki67, a marker of proliferation (J and K).

