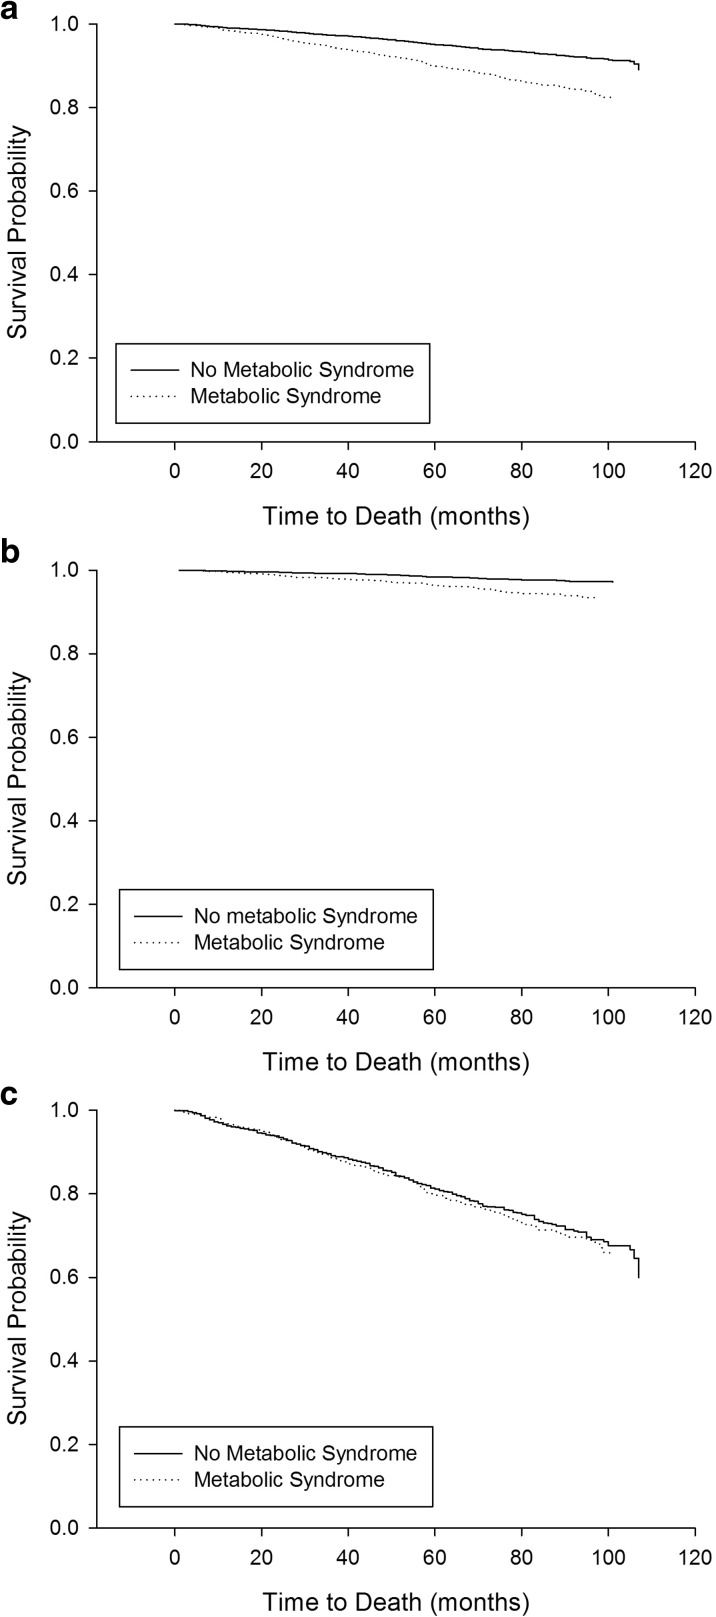
Fig. 2.
Kaplan-Meier curves for 10-year survival probability stratified by metabolic syndrome status for the whole sample (a), younger (under 65 years, b), and older (65 years and older, c) groups. Log rank analysis showed a significant difference between the curves for the whole sample and the younger group (p < 0.001), but not the older group (p = 0.48)

