Fig. 1.
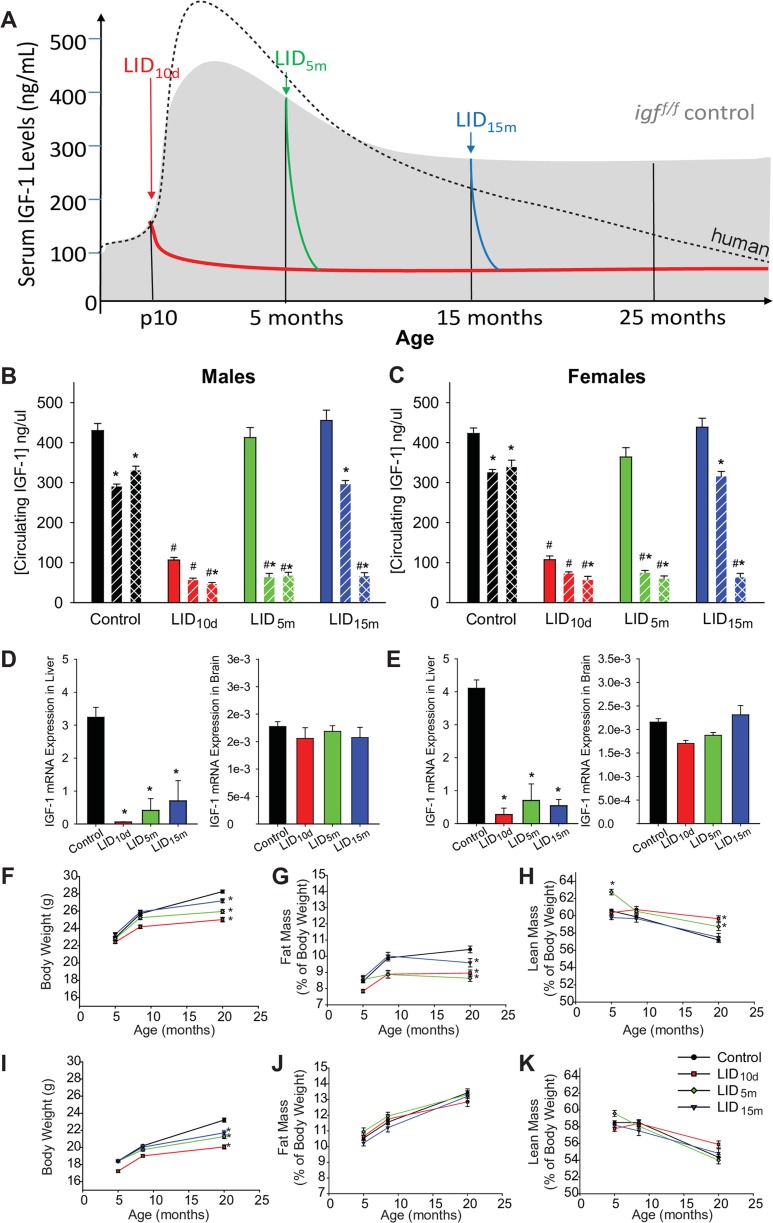
Inducing IGF-1 deficiency at distinct time periods of life. a Model of circulating IGF-1 levels throughout mouse life in the various treatment groups (LID10d, LID5m, LID15m). The black dotted line represents the average human concentrations of IGF-1 throughout the lifespan (scaled to match our study in mice). Average circulating IGF-1 levels were assessed with an ELISA at multiple time points in male (b) and female (c) mice. The solid bar indicates levels at 4–5 months of age, slanted bars indicate 12–15 months of age, and checkered bars indicate 24–25 months of age. The asterisk indicates significant difference from the 4–5-month blood levels while the pound sign indicates a significant difference from control (WT) mice at that age (n = 37–43 in the treatment groups, 113 male controls, and 123 female controls) (p < 0.05). d, e IGF-1 mRNA expression was assessed in the liver (left panels) and brain (right panels) of male (d) and female (e) mice at 25–27 months of age (n = 6–10). Body weight (f), fat mass normalized to body weight (g), and lean mass normalized to body weight (h) was measured in male mice at multiple time points in life. Body weight (f), fat mass normalized to body weight (g), and lean mass normalized to body weight (h) was measured in female mice at multiple time points in life. In panels d–k, the asterisk indicates significant difference compared to WT control (n = 37–43 in the treatment groups, 113 male controls, and 123 female controls) (p < 0.05)

