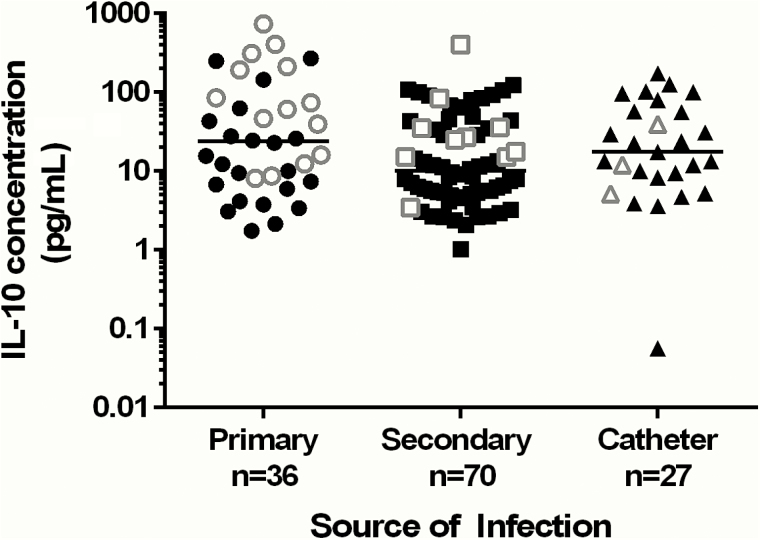
Figure 2.
Distribution of patient interleukin 10 (IL-10) concentrations according to primary, secondary, or catheter-associated source of Staphylococcus aureus bacteremia. All patient data points are presented with the black symbols representing patients who survived and the white symbols as patient deaths. The bar in each category represents the median IL-10 concentration.

