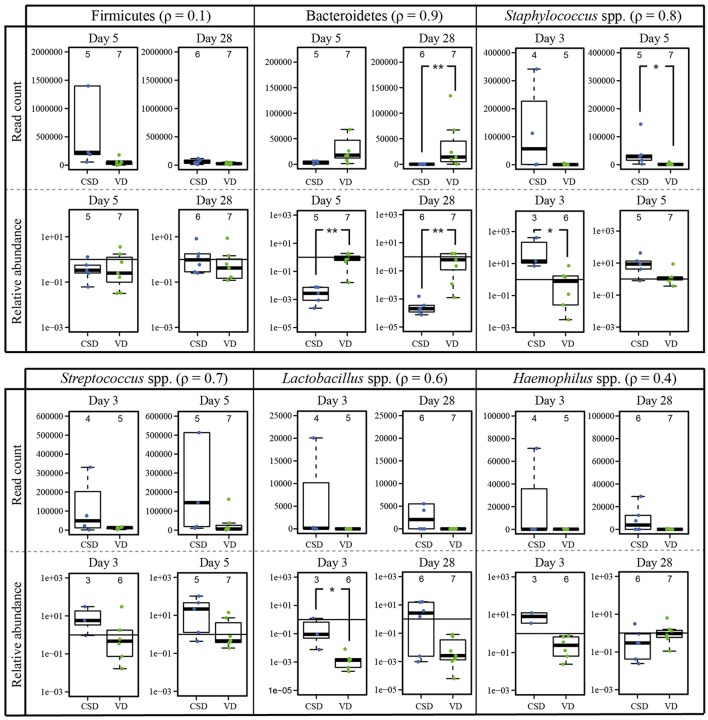
Figure 7.
qPCR validation of 16S rRNA gene sequencing data based differences according to delivery mode. Comparison of the DESeq2-normalized 16S rRNA read numbers and relative abundances (given on log scale) measured by qPCR for two phyla and four genera that were found to be significantly different between birth modes. For each comparison the Spearman correlation coefficient (ρ) was calculated and figures next to the taxa. The numbers of samples per collection time point are given at the top of each barplot. Significant differences according to a Wilcoxon rank sum test for delivery mode are represented by asterisks (* when P < 0.05; ** when P < 0.01). CSD, C-section delivery; VD, vaginal delivery. Fecal samples originating from CSD infants are represented on the left side of each barplot and by blue points, samples from VD infants are on the right side of each barplot and by green points.

