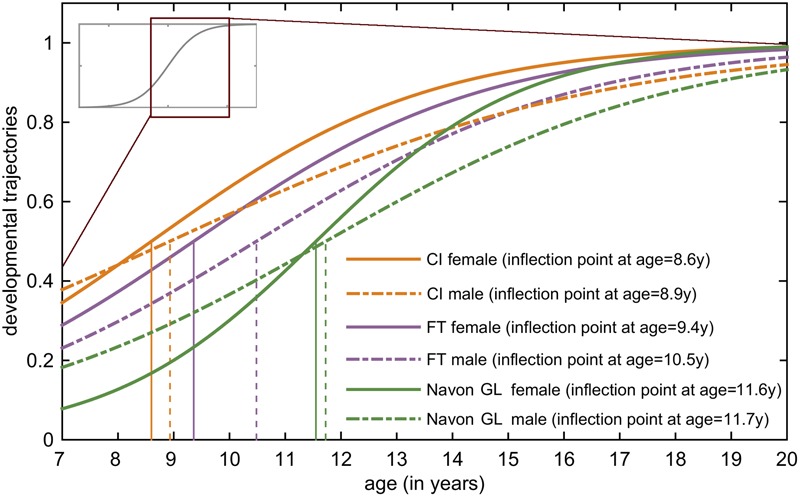
FIGURE 3.

Developmental trajectories of the tree tasks for females and males. In this figure, the most relevant areas of the fitted sigmoid curves are highlighted: these are the steepest parts of the slopes between the lower and upper plateau, the so called inflection points. The vertical lines project the inflection points of the sigmoid curves to the x-axis, showing the age when the maximum acceleration occurs according to the model. The earliest inflection points occur in the CI task (girls: 8.6 years, boys: 8.9 years), followed by the FT task (girls: 9.4 years, boys: 10.5 years). The latest inflection points appear in the Navon global–local task (girls: 11.5 years, boys: 11.7 years).
