Figure 1.
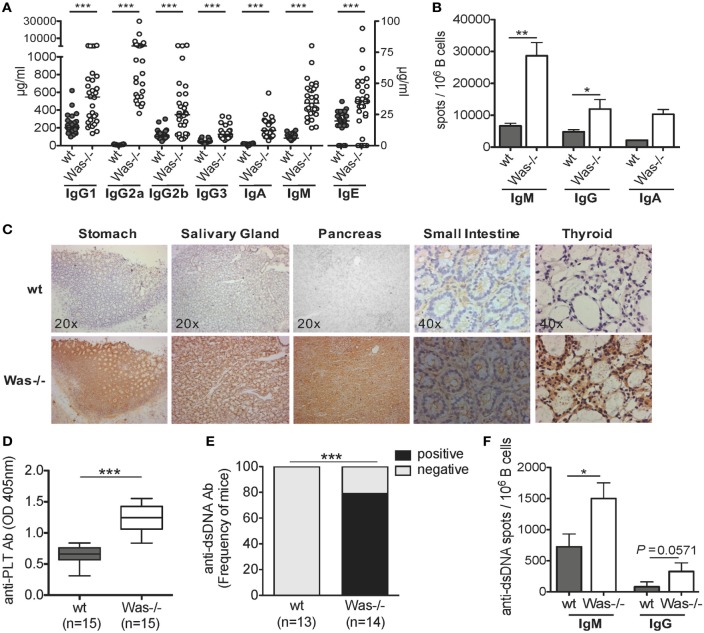
The presence of autoreactive B cells in Was−/− mice. (A) Serum levels of immunoglobulins (Igs) subclasses from wild-type wt (n = 28) and Was−/− (n = 30) mice are summarized in the graph. The scale on the right Y axis is specific for IgE levels. Median value is indicated as bar. (B) IgM-, IgG-, or IgA-secreting cells were evaluated by ELISpot assay performed on B cells isolated from the spleens of wt and Was−/− mice (IgM and IgG: wt n = 6, Was−/− n = 7; IgA: n = 3). The mean and SEM are shown. (C) Tissue-specific autoantibodies were detected by indirect immunohistochemistry performed on sections derived from different tissues from Rag2−/−/γc−/− mice incubated with sera of wt (n = 6) and Was−/− mice (n = 6). (D) The levels of autoantibodies against platelets present in the sera of wt and Was−/− mice were assessed by ELISA and expressed as optical density. Box and whisker plot shows the maximum and minimum value obtained. (E) Percentage of mice positive or negative for circulating autoantibodies against double-stranded DNA (dsDNA) evaluated in the sera of wt and Was−/− mice and assessed by ELISA. (F) Frequency of Ig-secreting cells against dsDNA was assessed by ELISpot assay performed with total splenic wt and Was−/− B cells. (A,B,D,F) Statistical significant differences were analyzed using the Mann–Whitney test (***P < 0.0001, **P < 0.005, and *P < 0.05). (E) Difference was statistically calculated by χ2 test (***P < 0.0005).

