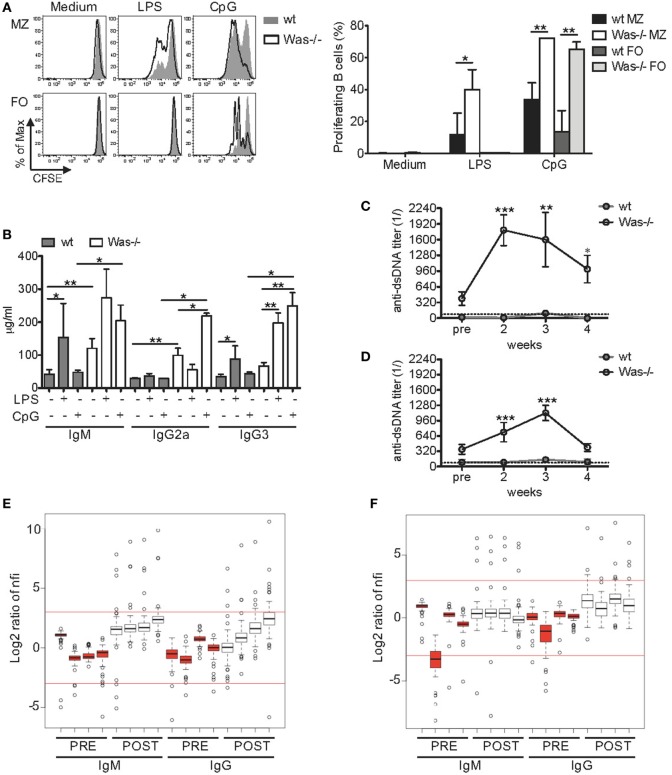
Figure 2.
Increased in vitro and in vivo response of Wiskott–Aldrich syndrome protein-deficient B cells to Toll-like receptor agonists. (A) Proliferation capacity was evaluated by CFSE dilution assay in sorted marginal zone (MZ) and follicular (FO) B cells isolated from spleen of wild-type (wt) and Was−/− mice and stimulated for 72 h with LPS (1 µg/mL), CpG (1 µg/mL), or medium alone. Representative histograms are shown in the left panel, and mean values ±SD are indicated in the bar graphs (three independent experiments). Significant differences are calculated with two-way analysis of variance (ANOVA) (**P < 0.01, and *P < 0.05). (B) Total immunoglobulin (Ig) M, IgG2a, and IgG3 levels were measured in the sera of wt and Was−/− mice receiving repeated injections of LPS, CpG, or PBS. Statistical differences were analyzed with the Mann–Whitney test (**P < 0.005 and *P < 0.05). (C,D) Kinetics of serum titers of anti-double-stranded DNA (dsDNA) antibodies circulating in wt and Was−/− mice after in vivo administration of LPS (C) or CpG (D) were evaluated by ELISA. Dotted lines indicate the serum titer considered negative for anti-dsDNA antibodies. Statistical differences were evaluated with two-way ANOVA (***P < 0.001, **P < 0.01, and *P < 0.05). (E,F) The positivity of serum IgM or IgG antibodies to 74 autoantigens was analyzed in the sera of Was−/− mice (n = 4) by an autoantibody array after in vivo administration of LPS (E) or CpG (F). The signal intensity of the autoantibodies before (PRE, red) and after (POST, white) the treatments was normalized for the background fluorescence, and the normalized fluorescence intensities (nfis) are shown as log2 ratio as respect to the average nfi of PRE Was−/− mice.

