Figure 5.
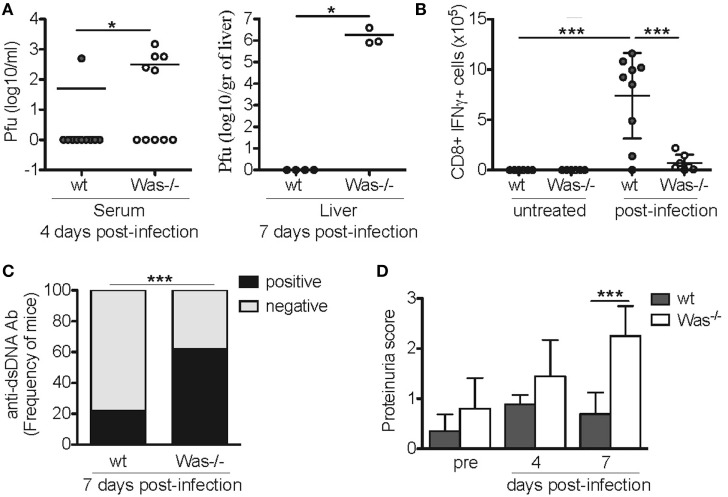
Lymphocytic choriomeningitis virus (LCMV) infection in Was−/− mice. (A) Quantification by plaque assay of the viral titers in the serum (left panel) and liver (right panel) of wild-type (wt) and Was−/− mice at the indicated time points after LCMV arm infection (106 p.f.u./mouse). Mann–Whitney test was applied to assess the significant differences between wt and Was−/− groups (*P < 0.05). (B) Assessment by intracellular IFNγ staining of the absolute number of GP33-specific CD8+ T cells recovered from the spleens of infected animals at the time of sacrifice. Mean values ±SD are reported in the graphs, and significant differences between wt and Was−/− groups were evaluated by one-way ANOVA test (***P < 0.0001). (C) Graph shows the percentage of mice positive or negative for circulating autoantibodies against double-stranded DNA (dsDNA) after LCMV arm infection, evaluated in the sera by ELISA (n = 10 mice per group). Significant differences were statistically calculated by χ2 test (***P < 0.0005). (D) Proteinuria scores were assessed before (pre) and 4 and 7 days after LCMV arm infection. Two-way ANOVA test was applied to assess the significant differences between wt and Was−/− groups (***P < 0.001, n = 10 mice per group).

