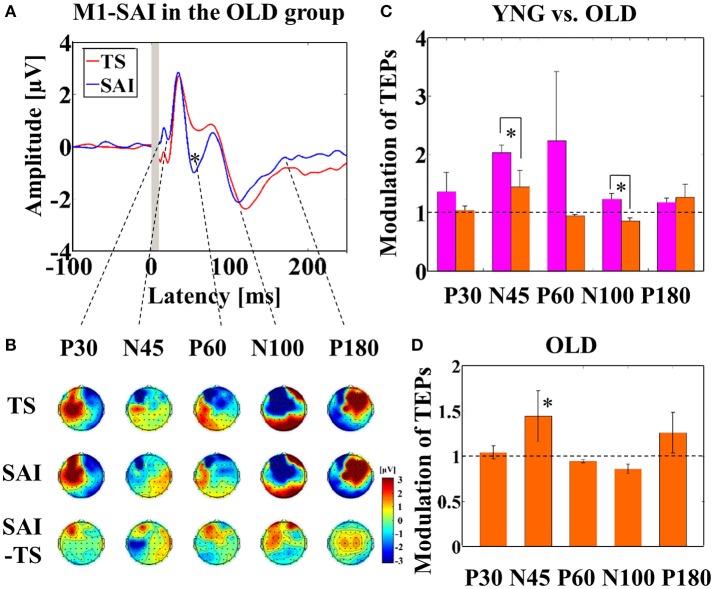
Figure 1.
Result of TEPs in M1–SAI paradigm. (A) The graph shows the TEP traces with individual somatosensory evoked potentials (SSEPs) subtraction. The graph depicts TEP traces averaged across the older participants for TS and SAI (ISI N20+2 ms) at the left central ROI. TMS was delivered at a time equivalent to 0 ms. (B) The illustration shows the EEG topographical plots for conditions of TS, SAI (ISI of N20+2), and the difference between TS and SAI obtained from M1–SAI experiment. Each vertical column depicts the TEP topoplots for P30, N45, P60, N100, and P180 component from left to right, respectively. (C) The bar graph shows the group differences between younger (pink bars) and older (orange bars) participants in the modulation of TEPs induced by M1–SAI. The cutoff of the graph is ratio of 1. Older participants demonstrates significantly lower modulation in N45 (t22 = 5.485, p < 0.0001) and N100 (t22 = 3.627, p = 0.001) TEPs in this paradigm. (D) The bar graph shows the modulation of TEPs within the older participants. The cutoff of the graph is ratio of 1. Older participants indicates significant modulation in N45 TEP (t11 = 4.062, p = 0.002) by M1–SAI.

