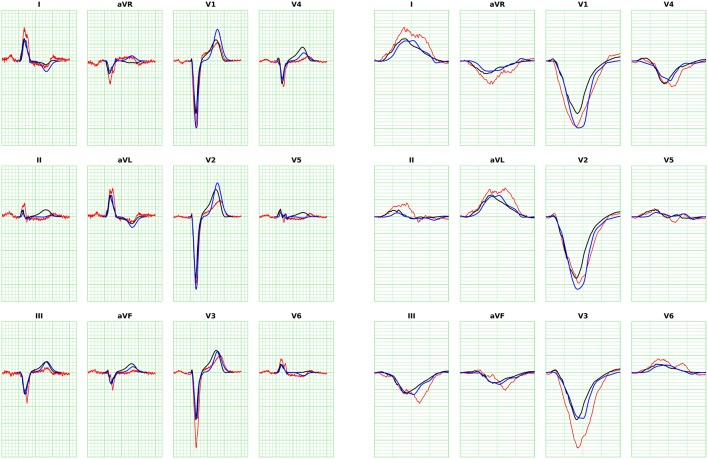
Figure 8.
ECG for Patient 1 (left) and magnification of QRS complex (right), computed with FM. The blue curve is the solution with the eikonal solver and the lead fields formulation. The black curve is the bidomain solution. The minor grid lines are spaced 40 ms on the horizontal axis and 0.1 mV on the vertical axis. The measured ECG of the patient is shown in red.

