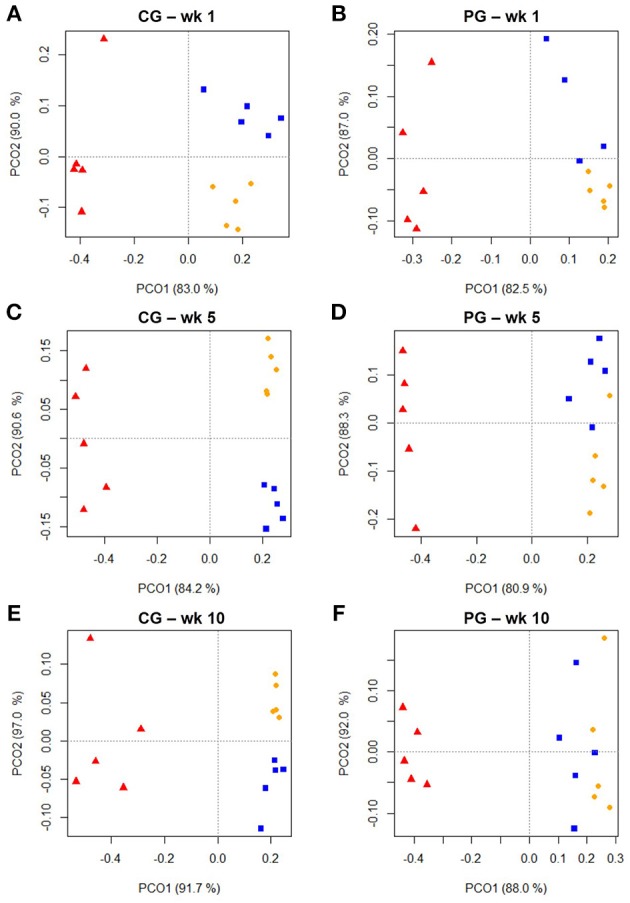
Figure 1.

Two dimensional PCO-plots from SSCP-gels of rumen liquid (LAB, orange dot), particle (PAB, blue square) and epithelium (EAB, red triangle) associated bacteria of the confinement group (CG) and pasture group (PG) in wk 1, wk 5, and wk 10 (explained variance indicated in % on x- and y-axis, n = 5). The CG stayed on a TMR based ration during the entire trial while the PG was slowly introduced to a pasture-based ration: wk 1: TMR, wk 2: TMR and 3 h pasture/d, wk 3 and 4: TMR and 12 h pasture/d, wk 5–10: pasture and 1.75 kg DM concentrate/d. Significance: (A) P = 0.001, (B) P = 0.001, (C) P = 0.001, (D) P = 0.001, (E) P = 0.001, (F) P = 0.002.
