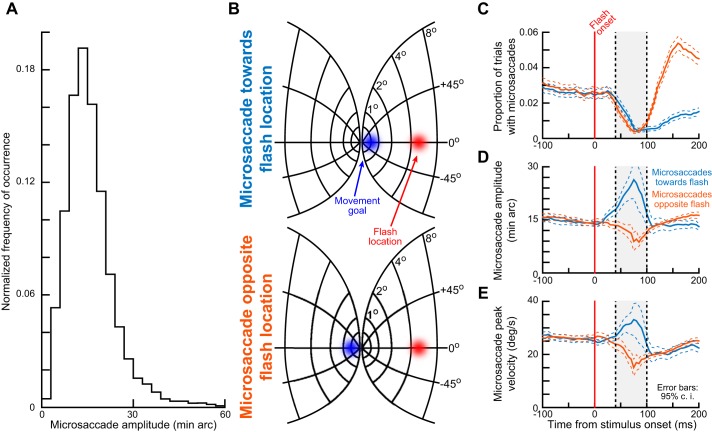
Fig. 2.
Interactions between the spatial geometry of visual stimulus location and the saccade goal location in the phenomenon of kinematic alteration (experiment 1). A: in experiment 1, a microsaccade was planned to a near eccentricity, whereas a visual stimulus was presented peripherally. We confirmed this spatial dissociation by plotting the distribution of microsaccade amplitudes observed in the interval from −150 to 205 ms relative to peripheral stimulus onset. Median microsaccade amplitude was 13.18 min arc, more than an order of magnitude less eccentric than the peripheral stimulus location (materials and methods). This is consistent with previous observations in monkeys and humans (Chen and Hafed 2013; Hafed et al. 2009; Hafed 2013). The histogram shown was normalized by the total number of observations (9,314 microsaccades from both monkeys). B: on a model of the SC map (Hafed and Chen 2016), the spatial dissociation is shown for a microsaccade either toward the flash location (top) or opposite it (bottom). In each case, the blue region of the spatial map would be the region of movement-related spiking activity at the time of movement execution, and the red region would be the region of stimulus-induced visual spikes that would occur after stimulus onset. Spatial readout of the map in the 2 scenarios predicts different patterns of executed saccade amplitudes. C: stimulus onset resulted in microsaccadic inhibition, as expected. graphs show the proportion of trials containing either “toward” (bluish color) or “opposite” (brownish color) microsaccades as a function of time after stimulus onset. Classic microsaccadic inhibition occurred. Note that the strong postinhibition difference between toward and opposite movements is expected given previous results (e.g., Tian et al. 2016). D: time courses of microsaccade radial amplitude as a function of time relative to peripheral stimulus onset. Near the time of microsaccadic inhibition (e.g., shaded region), microsaccade amplitude was modulated in a manner consistent with the predictions of spatial readout of oculomotor maps as in B. Toward microsaccades were consistently larger than opposite microsaccades. E: microsaccade peak velocity was also modulated, and one of our purposes in this study was to explore the relationships between the amplitude and peak velocity modulations (e.g., Figs. 4 and 7). Error bars denote 95% confidence intervals (c.i.).

