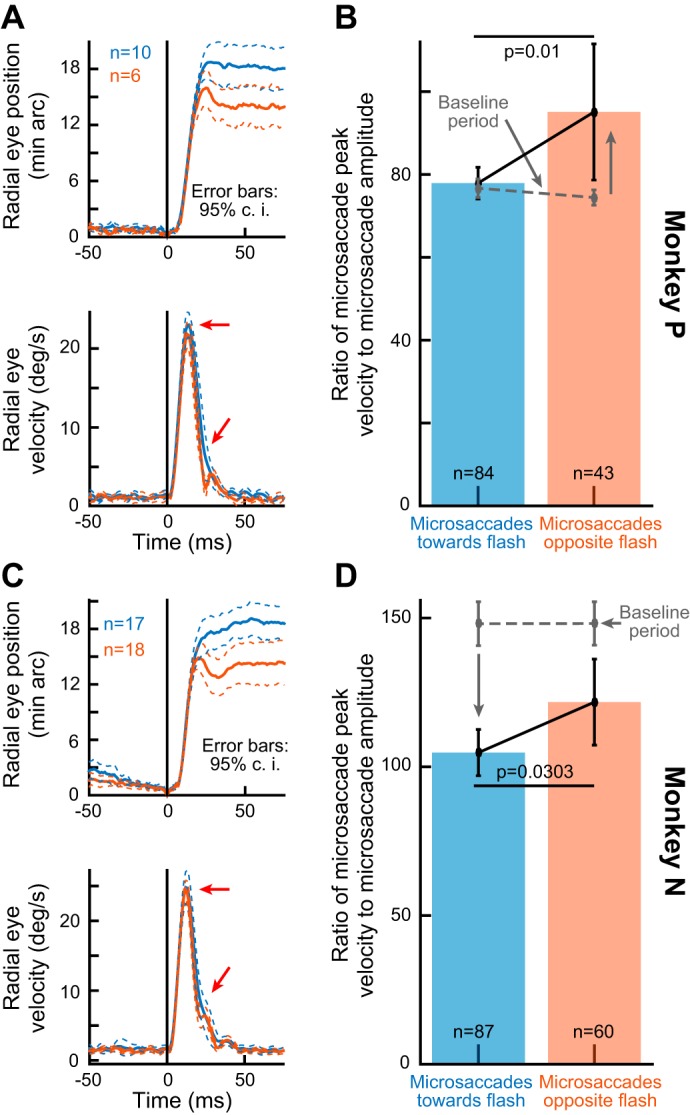
Fig. 4.

Consistency of kinematic alterations of microsaccades between “toward” and “opposite” movements occurring near the time of microsaccadic inhibition. A and C: for each monkey, we selected all microsaccades occurring within 40–100 ms after peripheral stimulus onset (Fig. 2B) that had a certain peak velocity (see the eye velocity trace in each panel and the horizontal red arrow). For those microsaccades, we plotted the average radial eye position trace. Toward microsaccades were consistently bigger than opposite movements despite matched peak velocities. Note that the velocity traces suggest faster deceleration for the opposite movements (diagonal red arrows), which contributes to the reduced amplitudes (as is the case with large saccades; e.g., Figs. 1 and 10). B and D: for all microsaccades occurring 40–100 ms after stimulus onset (regardless of peak velocity), we plotted the ratio of peak velocity to movement amplitude. This ratio was different between toward and opposite microsaccades in each monkey. Thus, in addition to amplitude and velocity variations (Fig. 2, D and E), the kinematics of microsaccades were also altered by the recently appearing visual flash. The gray data show the same ratio but for microsaccades occurring from −100 to −40 ms from stimulus onset. Error bars in all panels denote 95% confidence intervals.
