Fig. 1.
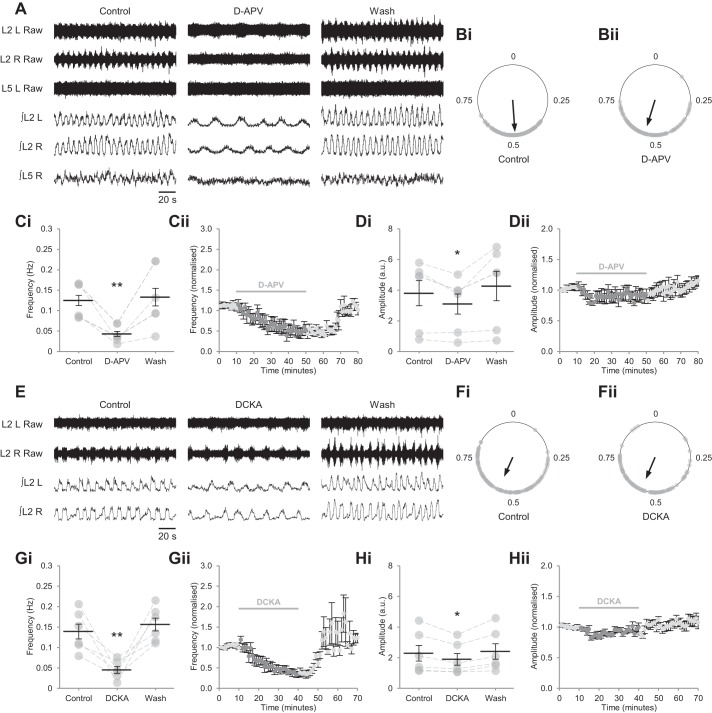
NMDARs determine the speed and amplitude of locomotor-related activity in spinal cord preparations from postnatal mice. A: raw (top) and rectified/integrated (bottom) traces recorded from the left and right L2 ventral roots (L2 L; L2 R) and right L5 ventral root (L5 R), showing the effect of the competitive glutamate-binding site antagonist d-APV (50 µM) on locomotor-related activity induced by 5-HT (15 µM) and DA (50 µM). B: left-right phase relationship in control conditions (Bi) and during application of d-APV (Bii). Circular plots represent the onset of locomotor bursts recorded from L2 R ventral roots (gray dots) in relation to the onset of activity recorded from corresponding L2 L roots (assigned a value of 0) in the same cycle. Vector direction indicates mean phase, and vector length corresponds to clustering of data points around the mean. We analyzed >100 burst cycles from 4 preparations for each condition. Ci: locomotor-burst frequency over 5 min during a control period, during a 40-min application of d-APV, and during a 30-min washout (Wash). Individual data points are shown in gray, and means are represented by black lines; n = 6 preparations. Cii: time-course plot of normalized data aggregated into 1-min bins showing a reduction in burst frequency during d-APV application; n = 6. Di: locomotor-burst amplitude over 5 min during a control period, during a 40-min application of d-APV, and during a 30-min washout; n = 6. Dii: time-course plot of normalized data aggregated into 1-min bins showing a reduction in burst amplitude during d-APV application; n = 6. E: raw (top) and rectified/integrated (bottom) traces recorded from L2 L and L2 R showing the effect of the competitive coagonist binding site antagonist DCKA (5 µM) on locomotor-related activity. F: left-right phase relationship in control conditions (Fi) and during application of DCKA (Fii). Circular plots represent the onset of locomotor bursts recorded from L2 R ventral roots (gray dots) in relation to the onset of activity recorded from corresponding L2 L roots (assigned a value of 0) in the same cycle. Vector direction indicates mean phase, and vector length corresponds to clustering of data points around the mean. We analyzed >100 burst cycles from 4 preparations for each condition. Gi: locomotor-burst frequency over 5 min during a control period, during a 30-min application of DCKA, and during a 30-min washout; n = 6. Gii: time-course plot of normalized data aggregated into 1-min bins showing a reduction in burst frequency during DCKA application; n = 6. Hi: locomotor-burst amplitude over 5 min during a control period, during a 30-min application of DCKA, and during a 30-min washout; n = 6. Hii: time-course plot of normalized data aggregated into 1-min bins showing a reduction in burst amplitude during DCKA application; n = 6. Error bars: ± SE. Statistically significant difference from control: *P < 0.05, **P < 0.01. a.u., Arbitrary units.

