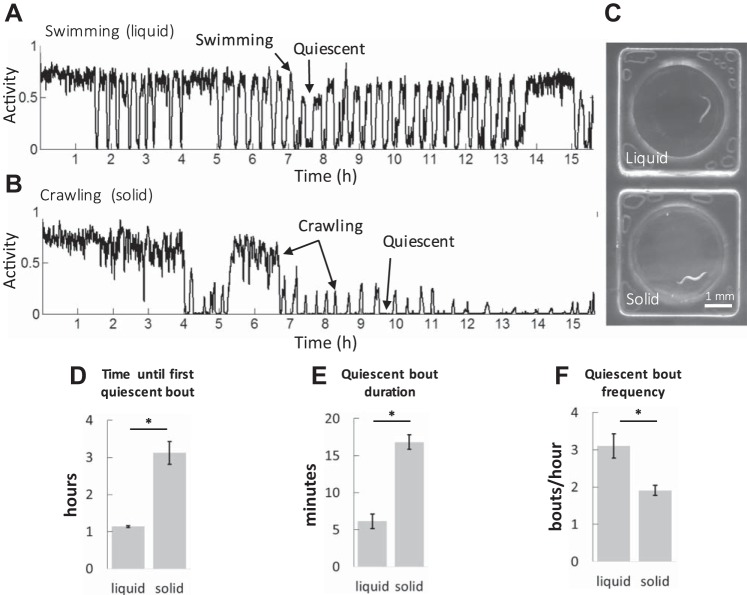
Fig. 1.
Fasting worms enter quiescence in different mechanical environments. “Activity” here and elsewhere in this study is given in arbitrary units scaled to relative body size (see methods). Actigraphs showing a single line plot (A and B) represent activity averaged each minute. A: example activity in NGMB. B: example activity in NGMB with 2% agarose. For each locomotory state indicated an arrow points to an example of corresponding activity. C: darkfield images of worms in a single WorMotel well in the liquid or solid condition. The images show representative postures for moving worms characteristic for each mechanical environment. D: latency until the onset of the first quiescent bout. n > 30 worms for each condition. Error bars show the SE of 2 experimental means, P = 0.02. E and F: bars show the error of the mean of n = 7 worms with 79 quiescent bouts and n = 20 worms with 115 quiescent bouts in liquid or solid, respectively. The time frame examined was hours 6–10 of the experiment. *P < 0.001.

