
Fig. 3.
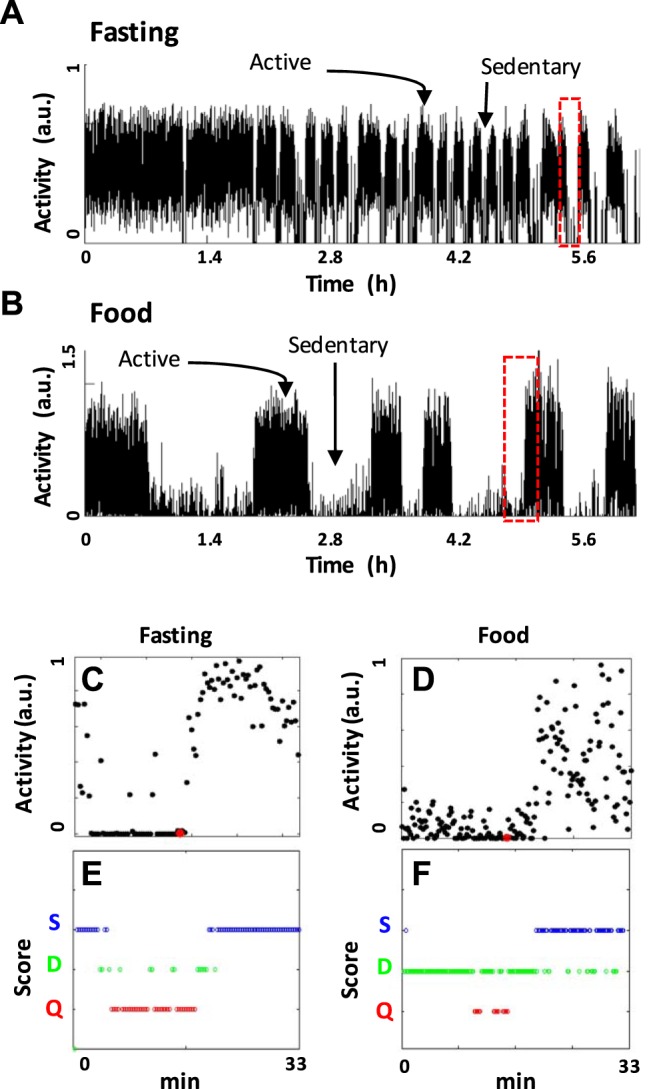
Example data and algorithm outputs used to calculate metrics about sedentary/active episodes and to quantify quiescent, dwelling, and swimming behavior. A and B: actigraphs of activity [in arbitrary units (a.u.)] scaled to the top 5% of activity displayed in the first 2.7 h of the assay with no temporal averaging. The graph shows black lines that connect the position between subsequently plotted data points. Data were plotted every 1 s. A: a representative fasting worm. B: a representative worm with 8× food present. The red highlighted regions in A and B are expanded in C–F. C and D: scaled activity as black dots plotted every 10 s. A red dot marks the algorithmically determined end of a sedentary episode and the beginning of an active episode. E and F: algorithmic scoring locomotory state. Plots show small open circular dots that each represent a unique score for the time point observed. Colored circles correspond to quiescence (red), dwelling (green), or swimming (blue). In these plots dots and circles are oversized and appear to overlap in the plot, but each time point is given only 1 score.