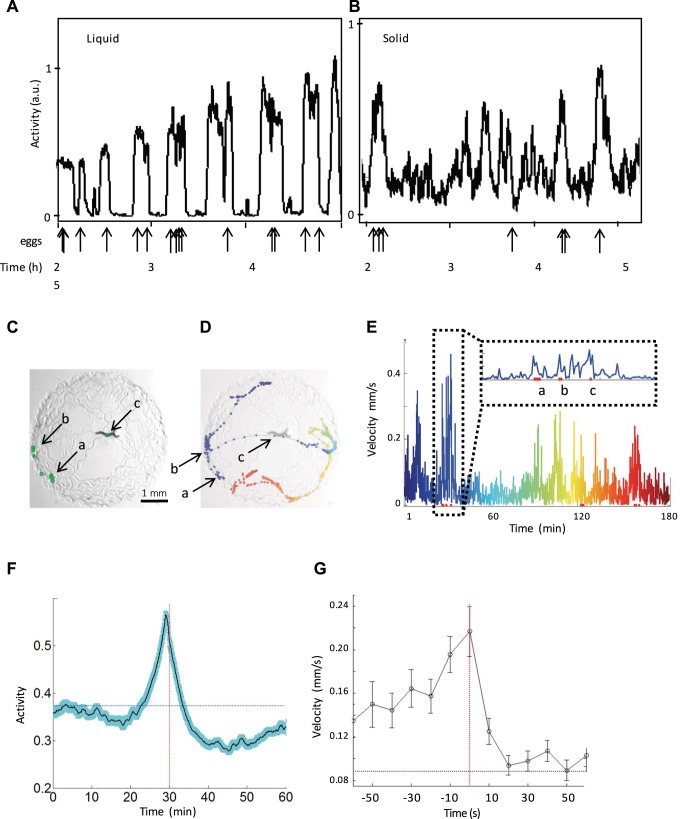
Fig. 6.
Egg-laying preferentially occurs during active episodes. A and B: actigraph showing activity for young adult worms in either liquid (in WorMotel; A) or solid (a standard NGM plate with a small lawn; B) media. Arrows below the x-axes point to manually scored egg-laying events. Ticks below these 2 graphs mark hours 2, 3, 4, and 5 of the assay, which is shown below the arrows. B: worm velocity was calculated every 10 s. C–E: an example of egg-laying events that are spread out spatially but occur during the same roaming episode. C: adult worm roaming. Black arrows labeled a, b, and c point to eggs laid (green ovals) within the same active episode; a, b, and c are also labeled in D and E. D: worm tracks marked by colored dots that begin at blue and end at red, overlaid on the image from C. The velocity observed at each colored point in time corresponds to the plot displayed in E. E: worm velocity of the worm shown in B–D calculated by tracking the centroid position of the worm every 10 s. Red dots at the base of the graph mark egg-laying events that correspond to the arrows shown in B. An expanded section shows a single active episode during which multiple egg-laying events occur. A chronologically coordinated color scale, ranging from blue to red, matches the colored dots that mark position of the worm on the lawn shown in D. F: activity alignment for the 30 min before and after egg-laying events; data from n = 361 events from 10 worms. The black line shows average activity, and the shaded cyan region shows standard error of the mean of aligned events. The horizontal blue dotted line shows the average activity observed for all activity values included in the experiment, and the vertical red dotted line marks the point to which all egg-laying events were aligned. G: velocity immediately before and after egg-laying in a 1-min window. The red line marks egg-lay timing, and the blue line marks the average velocity observed throughout the experiment including data outside the 1-min window shown.

