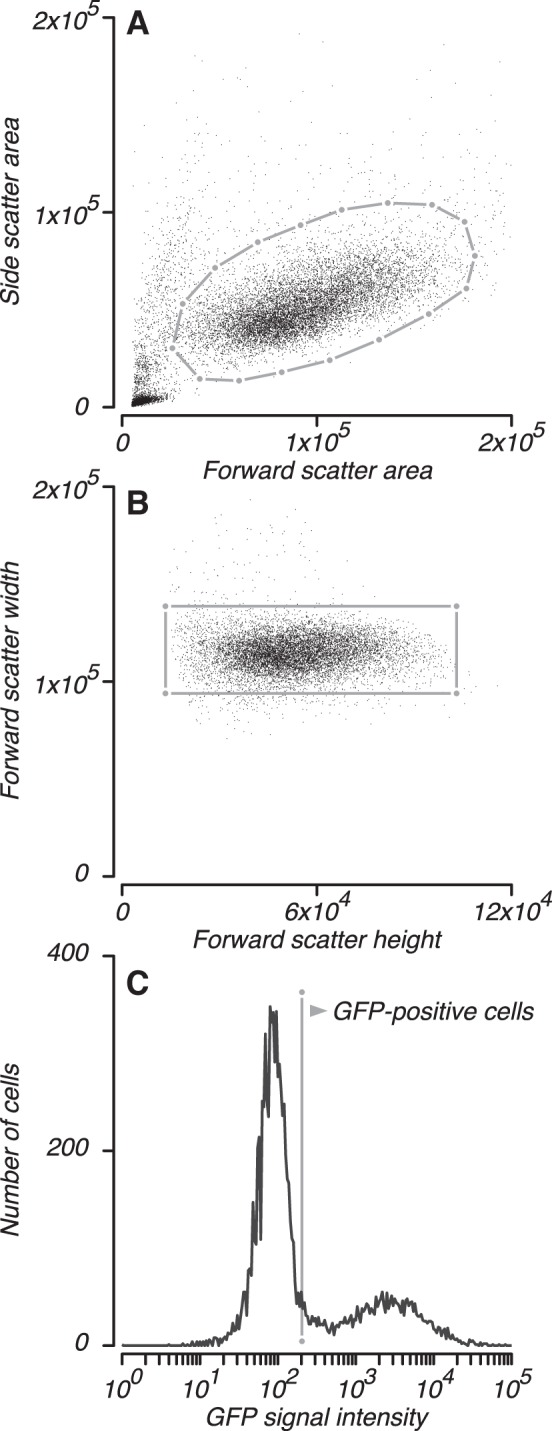
Fig. 2.

Flow cytometry methods. Cells were analyzed by fluorescence activated cell sorting. A: events were gated to exclude cellular debris and large aggregates of cells (gray polygon). B: events were also gated to exclude doublets of cells (gray rectangle). C: events that passed both gating procedures were analyzed for green fluorescent protein (GFP) signal; those that achieved a criterion level of GFP expression (gray line) were classified as GFP-positive.
