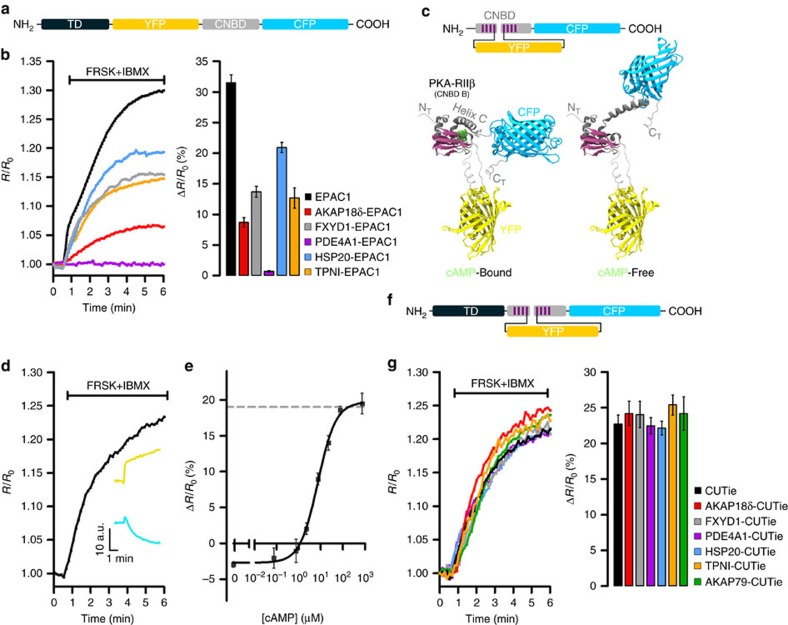
Figure 1. Generation of a universal FRET-tag for cAMP detection at specific macromolecular complexes.
(a) Schematic representation of the targeted Epac1-camps chimeras. CNBD, cyclic nucleotide binding domain; TD, targeting domain. (b) Representative kinetics of cAMP change (left panel) and summary of the experiments performed (right panel) in CHO cells expressing untargeted Epac1-camps (EPAC1) or its targeted versions upon application of the adenylyl cyclase activator forskolin (FRSK, 25 μM) and the phosphodiesterase inhibitor 3-isobutyl-1-methylxanthine (IBMX, 100 μM), a treatment that generates an intracellular amount of cAMP that saturates Epac1-cAMPs (ref. 27). AKAP18δ, A-kinase anchoring protein 18δ (ref. 17); FXYD1, phospholemman; HSP20, heat shock protein 20; TPNI, troponin I; PDE4A1, phosphodiesterase 4A1. Bars show FRET change at saturation. N≥5 from at least five independent experiments, all samples are significantly different from each other by one-way ANOVA and Bonferroni post hoc test, P≤0.05, except FXYD1-EPAC1 versus TPNI-EPAC1, which is not significant. (c) Top: schematic representation of CUTie. Bottom: ribbon representation of the predicted molecular structures of CUTie in its cAMP-bound or cAMP-free forms. cAMP is shown in green. (d) Representative kinetics of FRET change and corresponding CFP and YFP emission intensity curves (inset) recorded in a CHO cell expressing CUTie and treated with a saturating stimulus. (e) Concentration–response calibration curve generated using CHO cells expressing CUTie and microinfusion of known concentrations of cAMP via a patch pipette. EC50=7.4 μM, sensitivity range between 0.5 μM and 50 μM. Hill coefficient is 1.07. Broken line indicates maximal FRET change as predicted by MD simulations. (f) Schematic representation of CUTie chimeras. For each concentration point N≥5 from at least five independent experiments. (g) Representative kinetics of FRET change (left panel) and mean maximal FRET change (right panel) recorded at saturation. N≥10 from three independent experiments. One-way ANOVA analysis with Bonferroni's post hoc correction shows no significant difference between all samples. AKAP79, A-kinase anchoring protein 79. All values are means±s.e.m.

