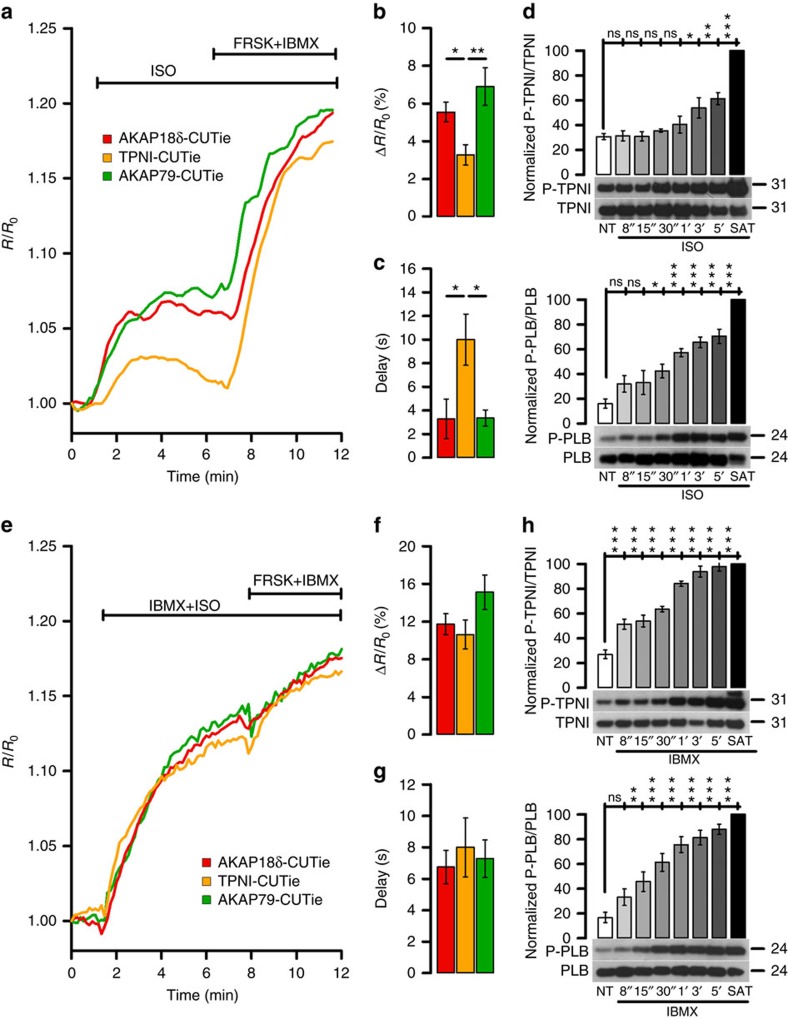
Figure 3. Differential regulation of the cAMP signal at different β-adrenergic targets.
(a) Representative kinetics and summary (b) of FRET change recorded in ARVM individually expressing AKAP18δ-CUTie, TPNI-CUTie or AKAP79-CUTie in response to bath application of 5 nM ISO. One-way ANOVA with Bonferroni's post-hoc correction. (c) Delay from application of 5 nM ISO to first time point at which a FRET change was detected for all experiments performed as in a. One-way ANOVA with Bonferroni's post hoc correction. (d) Time course of TPNI (top) and PLB (bottom) phosphorylation on application of 1 nM ISO to NRVMs. The level of phosphorylation on application of a saturating stimulus (SAT: 25 μM FRSK+100 μM IBMX) for 10 min is also shown. NT, no treatment. N=5 biological replicates. One-way ANOVA with Dunnett's post hoc correction (all columns versus NT column). (e) Representative kinetics and summary (f) of FRET change recorded in ARVM individually expressing AKAP18δ-CUTie, TPNI-CUTie or AKAP79-CUTie in response to bath application of 1 nM ISO in combination with 100 μM IBMX. One-way ANOVA with Bonferroni's post hoc correction. (g) Delay from application of 1 nM ISO+100 μM IBMX to first time point at which a FRET change was detected for all experiments performed as in e. (h) Time course of TPNI (top) and PLB (bottom) phosphorylation on application of 100 μM IBMX to NRVM. N=5 biological replicates. One-way ANOVA with Dunnett's post hoc correction (all columns versus NT column). Bars indicate means±s.e.m. For (b,c,f,g) N≥7 from at least N=5 biological replicates. *P≤0.05, **P≤0.01, ***P≤0.001.

