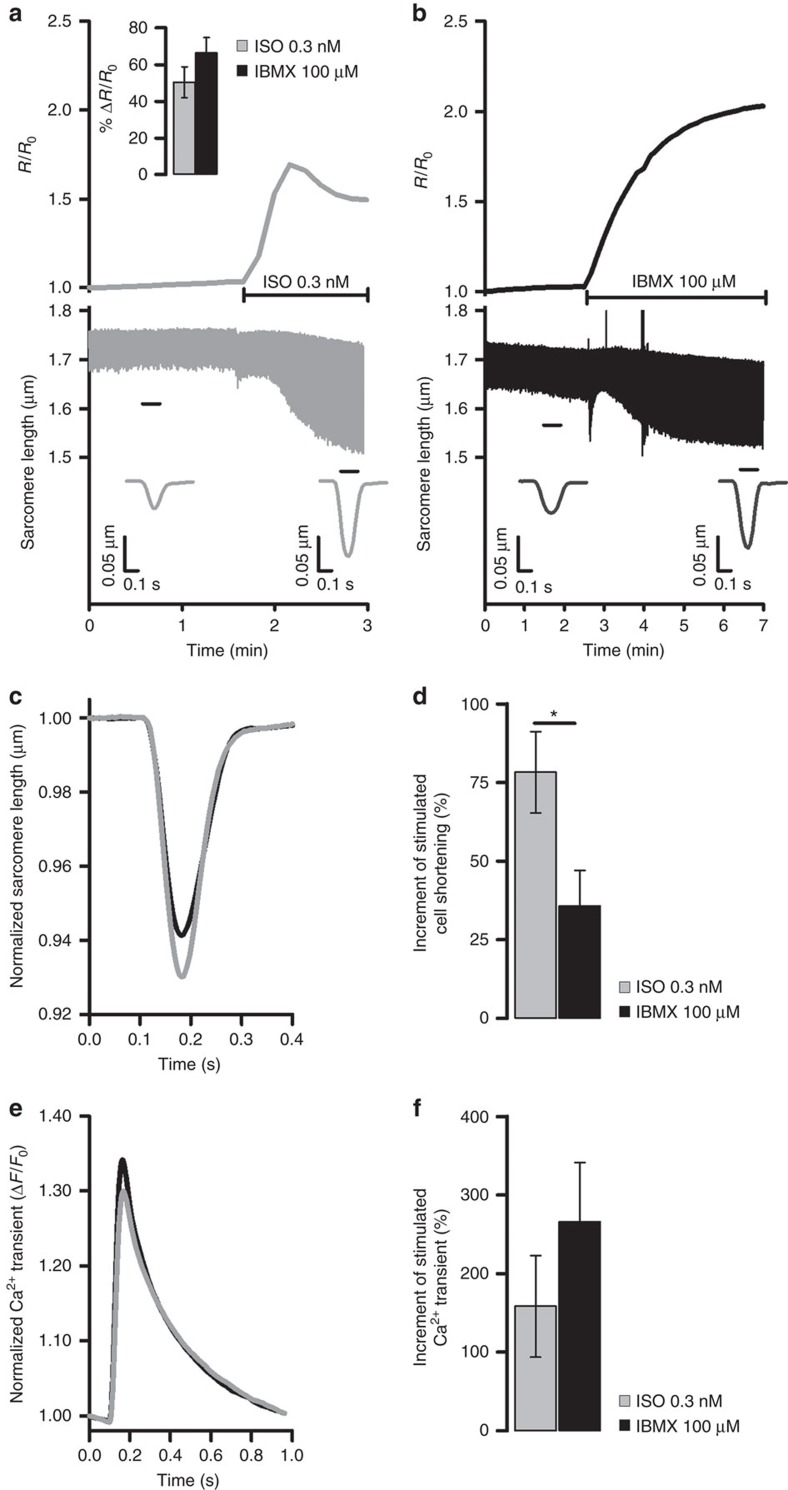
Figure 4. Differential local regulation of cAMP signals is necessary for maximal stimulated inotropy.
(a) Representative time course of global cytosolic cAMP change (top) and sarcomere shortening (bottom) recorded simultaneously in the same ARVM expressing the cytosolic FRET reporter EPAC-SH187 on application of 0.3 nM ISO or (b) 100 μM IBMX. Inset at the top of a shows mean FRET change measured in ARVM expressing the cytosolic FRET reporter EPAC-SH187 on application of 0.3 nM ISO or 100 μM IBMX. Bars are means±s.e.m., no significant difference by unpaired t-test. In a,b cells were paced at 1 Hz. Inserts at the bottom of a,b indicate sarcomere shortening kinetics averaged over the time interval indicated by the black bar. (c) Normalized mean sarcomere shortening kinetics measured at steady state after the application of ISO (0.3 nM) or IBMX (100 μM), as indicated. (d) Effect of 0.3 nM ISO or 100 μM IBMX on sarcomere shortening measured in all experiments as shown in a,b. Shortening is expressed as percent increment over control (before the stimulus) calculated as (Δ shortening/shorteningcontrol) × 100, where Δ shortening=(shorteningstimulated–shorteningcontrol). Unpaired t-test. (e) Averaged normalized Ca2+ transient recorded on application of 0.3 nM ISO or 100 μM IBMX. N≥6. (f) Effect of 0.3 nM ISO or 100 μM IBMX on the amplitude of the Ca2+ transient expressed as percent increase over control (before the stimulus). Unpaired t-test shows no significant difference. Bars are means±s.e.m. *P≤0.05. For all experiments N≥6 from at least three biological replicates.

