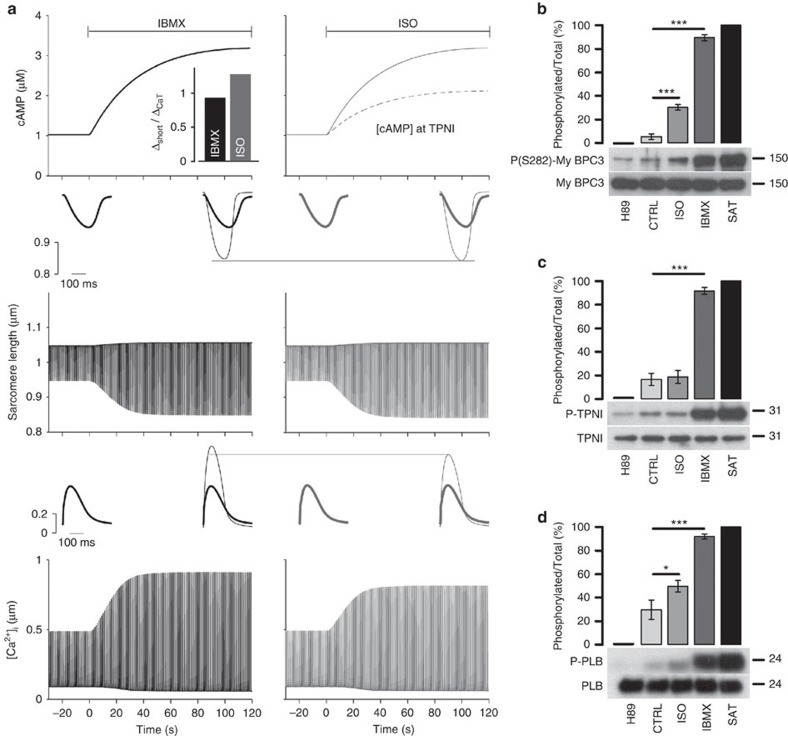
Figure 5. Mathematical model of compartmentalized cAMP signalling.
(a) Simulated cAMP rise (top), myocyte shortening (middle) and Ca2+ transient (bottom) upon administration of IBMX or ISO at time=0 s. Inset at the left shows baseline condition, and inset at right shows overlapping baseline condition (grey) and steady-state response to cAMP increase. Bar graph in a shows the ratio of the increase in maximal shortening to increase in Ca2+ transient amplitude induced by IBMX and ISO. (b) Western blotting analysis of cell lysates obtained from ARVM treated with H89 (30 μM), vehicle (CTRL), ISO (0.3 nM), IBMX (100 μM) or 25 μM FRSK+100 μM IBMX (SAT) for 10 min. Membranes were probed for total and phosphorylated MyBPC (b), TPNI (c) and PLB (d). Graphs show densitometric analysis and present the ratio value of phosphorylated to total protein expressed as percentage after normalization to H89 treatment (taken as zero) and to maximal phosphorylation at saturation (taken as 100%). Values are means±s.e.m. *P≤0.05, ***P≤0.001. N≥8 independent experiments from at least five biological replicates. One-way ANOVA with Dunnett's post hoc correction.

