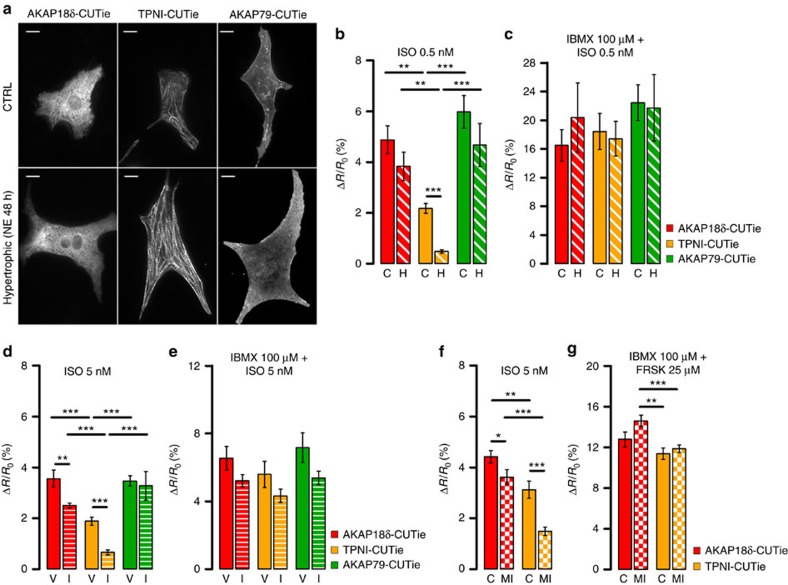
Figure 6. Compartmentalized cAMP signalling in hypertrophic cells.
(a) Localization of the targeted CUTie reporters in control (top) and hypertrophic (bottom) NRVM. Scale bar: 10 μm. Average cell size for control myocytes was 351.8±7.3 μm2 and for hypertrophic myocytes 674.9±14.8 μm2 (N≥216 cells from five biological replicates, P≤0.001). (b) Mean FRET change measured with targeted CUTie reporters in control (C) and hypertrophic (H) NRVM on application of 0.5 nM ISO and (c) 0.5 nM ISO in the presence of 100 μM IBMX. N≥6 from five biological replicates. (d) Mean FRET change measured with targeted CUTie reporters in isolated ARVM from minipump vehicle- (V) and ISO-infused (I) rats, on application of 5 nM ISO and (e) 5 nM ISO in the presence of 100 μM IBMX. N≥8 from at least six biological replicates. Bars indicate means±s.e.m. Unpaired t-test. (f) Mean FRET change measured with targeted CUTie reporters in isolated ARVM from age-matched control (C) and rats subjected to myocardial infarction (MI) at 16 weeks after coronary artery ligation, on application of 5 nM ISO and (e) saturating stimulus. N≥16 from at least seven biological replicates. In all graphs bars indicate means±s.e.m. Unpaired t-test applied for comparison between treatment groups, one-way ANOVA and Bonferroni's post hoc test for comparison among sensors. *P≤0.05, **P≤0.01, ***P≤0.001.

