
FIG 1.
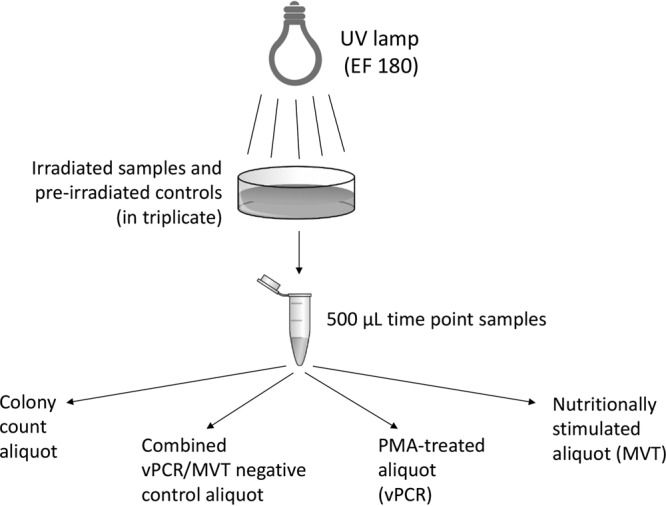
Flow diagram of the experimental design. Experiments comparing vPCR and MVT readouts for UV-irradiated bacteria are depicted.
Official websites use .gov
A
.gov website belongs to an official
government organization in the United States.
Secure .gov websites use HTTPS
A lock (
) or https:// means you've safely
connected to the .gov website. Share sensitive
information only on official, secure websites.
Flow diagram of the experimental design. Experiments comparing vPCR and MVT readouts for UV-irradiated bacteria are depicted.