FIG 2.
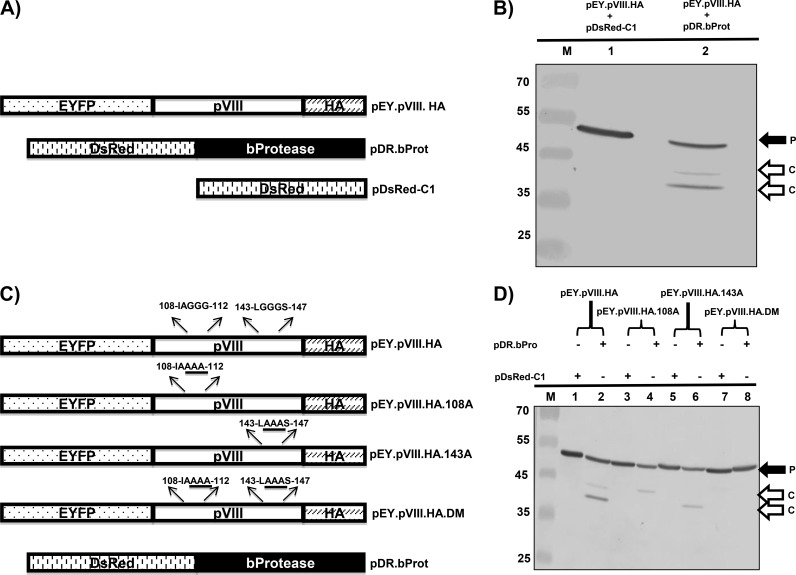
Cleavage of BAdV-3 pVIII protein in transfected cells. (A) Schematic diagram of plasmid DNAs. The names of the plasmids are depicted on the right of diagrams. The EYFP (enhanced yellow fluorescent protein)-pVIII (BAdV-3), bProtease (BAdV-3), and DsRed DNA plasmids are depicted. (B) Cleavage of BAdV-3 pVIII in transfected cells. Proteins from the lysates of 293T cells cotransfected with the indicated plasmid DNAs were separated by 12% SDS-PAGE, transferred to nitrocellulose membrane, and analyzed by Western blotting using anti-GFP antibody. P, uncleaved EY.pVIII.HA fusion protein; C, cleaved product. The molecular mass markers (lane M) in kilodaltons are shown on the left. (C) Schematic diagram of plasmid DNAs showing potential protease cleavage sites. The origin of the DNA is depicted. The amino acid sequences of potential protease cleavage sites are depicted above the diagrams, and glycine-to-alanine substitutions are underlined. (D) Cleavage of BAdV-3 pVIII mutant proteins in transfected cells. Proteins from the lysates of 293T cells cotransfected with the indicated plasmid DNAs were separated by 12% SDS-PAGE, transferred to nitrocellulose membranes, and analyzed by Western blotting using anti-GFP antibody. The molecular mass markers (M) in kilodaltons are shown on the left. P, uncleaved fusion protein; C, cleaved product.

