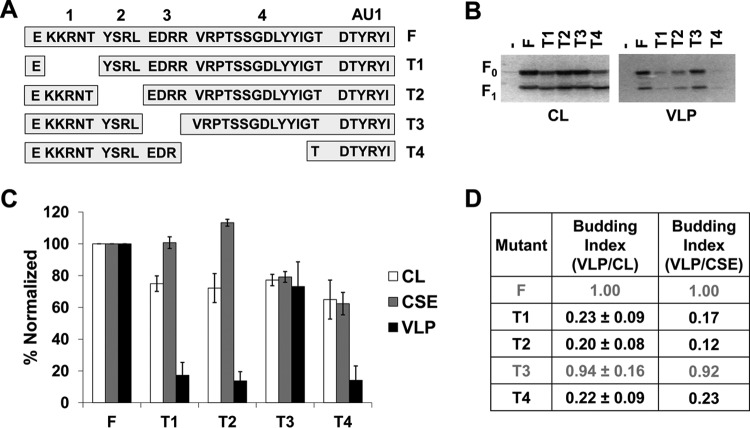
FIG 3.
Specific regions of the NiV F cytoplasmic tail drive its ability to form VLPs. (A) Schematic designating regions of the NiV F CT and showing the sequence for four deletion mutants made. (B) HEK293T cells were transfected for 24 h with an empty vector, wild-type NiV F, or one of the four CT mutants. Both cell lysates and VLPs were harvested and subjected SDS-PAGE, followed by Western blot analysis. (C) Densitometry was used to quantify band intensity for cell lysates and VLPs. In addition, flow cytometric analyses were used to evaluate the levels of cell-surface expression (CSE) for each of the mutants relative to the wild-type F. (D) As in Fig. 1, the cell lysate and VLP band intensities were used to calculate budding indices, and all were normalized to wild-type F. A similar index is also shown using values for VLP intensity and corresponding CSE values. Mutants exhibiting budding at levels significantly below those of wild-type F have their values in black. Error bars designate values for standard errors of the mean. Three or more independent experiments were used for each ratio, and the statistical significance was evaluated with one-sample t tests.

