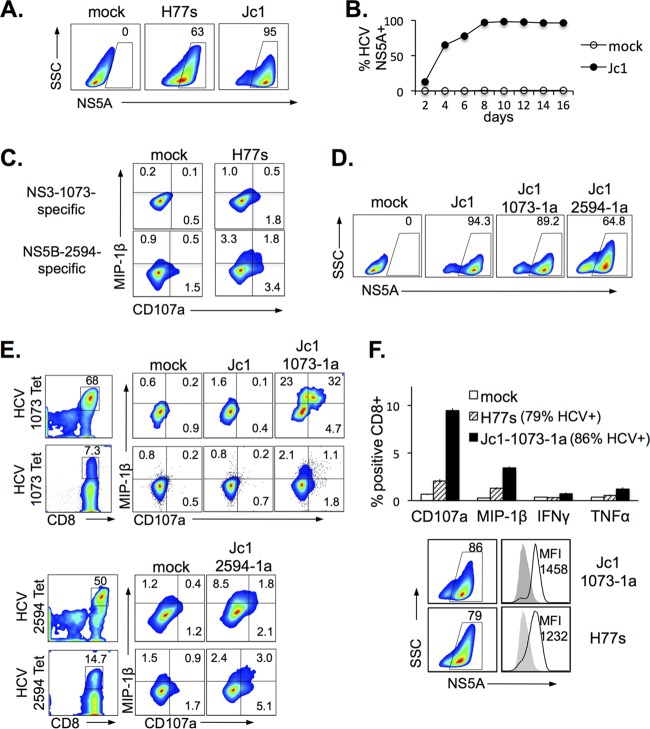
FIG 3.
Natural and engineered HCV-specific CD8 T cells are activated by HCV-transfected or HCV-infected Huh7.5A2 cells that express endogenously processed and presented genotype 1a-derived cognate HCV epitopes. (A) HCV expression, detected by anti-HCV NS5A, in Huh7.5A2 cells following transfection with the H77s (genotype 1a) or Jc1Gluc2A (genotype 2a) construct. (B) Kinetics of HCV NS5A expression in Huh7.5A2 cells after infection with the culture supernatant of Jc1Gluc2A-transfected Huh7.5A2 cells. (C) Representative results of FACS showing HCV-specific activation of HCV NS3-1073-specific (top) and HCV NS5B-2594-specific (bottom) nT cells upon coculture with HCV H77-transfected but not mock-transfected Huh7.5A2 cells. (D) Representative FACS showing HCV NS5A expression in Huh7.5A2 cells following infection with Jc1, Jc1-1073-1a, and Jc1-2594-1a. (E) Activation of CD8 T cells specific for genotype 1a-derived HCV NS3-1073 or NS5B-2594 by Huh7.5A2 cells infected with Jc1 epitope mutants but not with the original Jc1 clone. Results are shown for nT cells (top) and eT cells (bottom). NS3-1073- or NS5B-2594-specific CD8 T cells were detected by MHC/peptide tetramer (left) and activated by endogenous epitope presentation from HCV-infected (but not mock- or Jc1-infected) Huh7.5A2 cells (right). To examine HCV-specific CD8 T-cell activation, HCV-infected or -transfected Huh7.5A2 cells were seeded at 1 × 10⁵ cells in a 48-well flat-bottom plate or 2 × 10⁵ cells in a 24-well flat-bottom plate and incubated overnight to 24 h before coculture with 0.5 × 10⁵ to 1 × 10⁵ nT or eT cells for 6 h in 3 to 4 replicates, followed by FACS analysis. (F) (Top) Comparison of HCV-specific CD8 T-cell effector function between mock-infected, H77s-transfected (79% HCV+), and Jc1-1073-1a-infected (86% HCV+) Huh7.5A2 cells. Error bars indicate standard deviations. (Bottom) HCV expression of H77s-transfected and Jc1-1073-1a-infected Huh7.5A2 target cells by FACS multicolor plots and histogram overlays (the gray-shaded histogram represents the mock-infected control). Numbers in the FACS plots indicate the frequency of the parent for gated cells.

