FIG 6.
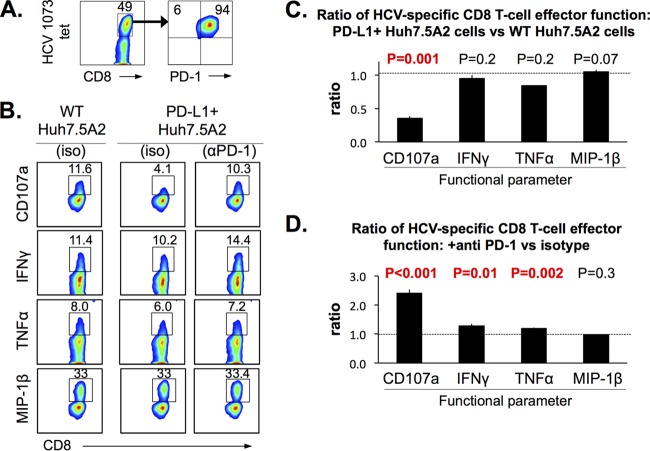
The HCV-specific CD8 effector T-cell function is blunted by PD-L1 expression in Huh7.5A2 cells and enhanced by PD-1 blockade. (A) A representative FACS plot showing high levels of PD-1 expression in the HCV-specific CD8+ T-cell line used in the assay. (B) Representative FACS plots of HCV-specific CD8 T cells cocultured with peptide-pulsed Huh7.5A2 cells without PD-L1 expression (WT Huh7.5A2) and with PD-L1 expression (PD-L1+ Huh7.5A2, 99.9% PD-L1+ cells) pretreated with isotype IgG (iso) or anti-PD-1 blocking antibody (αPD-1). (C) Ratio of the HCV-specific CD8 T-cell effector function upon coculture with PD-L1+ Huh7.5A2 cells and WT Huh7.5A2 cells. (D) Ratio of HCV-specific CD8 T-cell effector functions (CD107a mobilization and expression of IFN-γ, TNF-α, and MIP-1β) between cocultures of PD-L1+ Huh7.5A2 cells that were pretreated with anti-PD-1 or with isotype antibody. Huh7.5A2 cells were plated at 1 × 10⁵ cells in a 48-well flat-bottom plate and incubated for 24 h before the addition of 0.3 × 10⁵ nT cells for 6 h. The Huh7.5A2 cells in selected wells were pulsed with 10 μg/ml peptides for 1 h and washed 2 times with medium before the addition of T cells. Dotted horizontal lines indicate a ratio of 1.0. Error bars indicate standard deviations. P values were calculated by the Student t test (n = 3). Numbers in the FACS plots indicate the frequency of the parent for gated cells.

