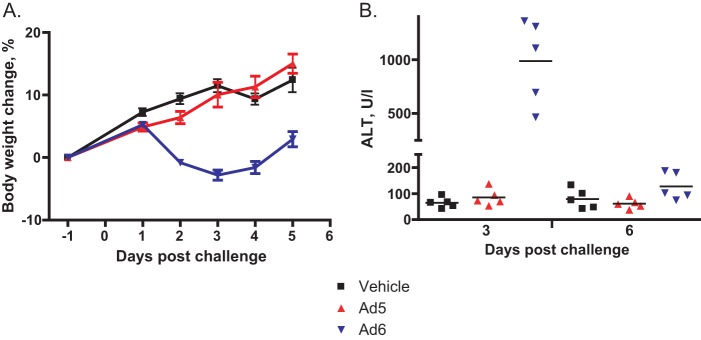
FIG 1.
Ad6 but not Ad5 induced morbidity in immunocompetent hamsters. A dose of 6 × 10¹⁰ PFU/kg of virus was injected intravenously. (A) Body weight changes. Each symbol represents the group mean; the whiskers symbolize the standard deviations. Vehicle versus Ad6, P < 0.0001 (two-way ANOVA). (B) Serum alanine transaminase levels. Each symbol represents the value from an individual animal; the horizontal bars signify the mean value for each group. Day 3, vehicle versus Ad6, P = 0.0079, and Ad5 versus Ad6, P = 0.0079; day 6, vehicle versus Ad6, P = 0.2222, and Ad5 versus Ad6, P = 0.0159 (Mann-Whitney U test).

