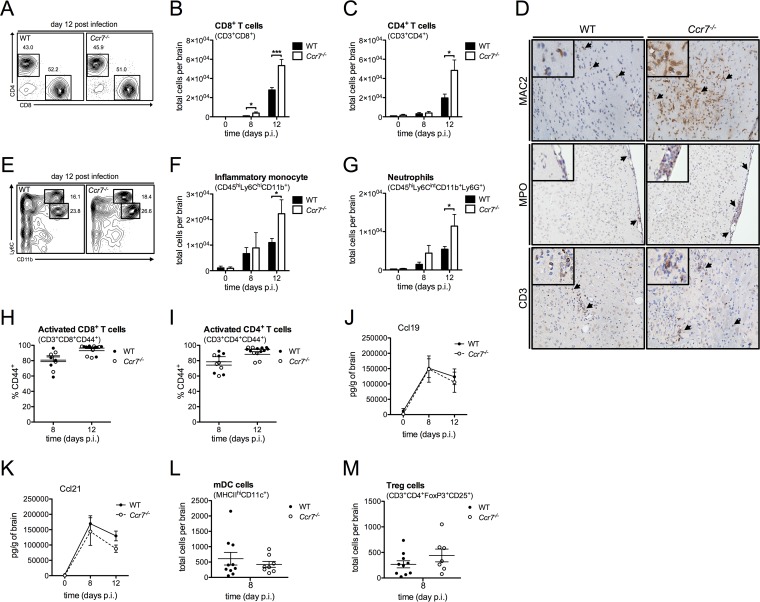
FIG 3.
Leukocyte infiltration into the CNS is enhanced in WNV-infected Ccr7−/− mice. (A) Dot plots of CD8+ T cells (lower right box) and CD4+ T cells (upper left box), after forward scatter/side scatter and UV-negative CD3+ gating, are shown at day 12 postinfection based on flow cytometry analysis from the CNS of WT and Ccr7−/− mice. (B, C, and F to I) Following forward scatter/side scatter and UV-negative gating for live cells, total cell numbers of CD8+ T cells (CD3+ CD8+), CD4+ T cells (CD3+ CD4+), inflammatory monocytes (CD45hi Ly6Chi CD11b+), neutrophils (CD45hi Ly6Cint CD11b+ Ly6G+; Ly6Cint indicates an intermediate expression level of Ly6C), activated CD8+ T cells (CD3+ CD8+ CD44+), and activated CD4+ T cells (CD3+ CD4+ CD44+) were assessed by flow cytometry from the CNS on days 0, 8, and 12 postinfection of WT and Ccr7−/− mice. (D) Paraffin-embedded brain sections from WT and Ccr7−/− mice on day 12 postinfection were stained for MAC2, myeloperoxidase (MPO), and CD3, and positive cells (shown in brown; indicated by black arrows) are shown within the parenchyma and meninges of WNV-infected mice. Representative images are shown at a magnification of ×20, with zoomed-in insets. (E) Dot plots of inflammatory monocytes (top box) and neutrophils (bottom box), after forward scatter/side scatter and UV-negative CD45hi gating, are shown at day 12 postinfection based on flow cytometry analysis from the CNS of WT and Ccr7−/− mice. (J and K) Protein levels of CCL19 and CCL21 from the CNS on days 0, 8, and 12 of WT and Ccr7−/− mice were measured by an ELISA. (L and M) Following forward scatter/side scatter and UV-negative gating for live cells, total cell numbers of mDCs (MHC-IIhi CD11c+) and Treg cells (CD3+ CD4+ FoxP3+ CD25+) were assessed by flow cytometry from the CNS on day 8 postinfection in WT and Ccr7−/− mice. Data are shown as means ± standard deviations for n = 3 to 9 mice per genotype and time point from two independent experiments. *, P < 0.05; ***, P < 0.001.

