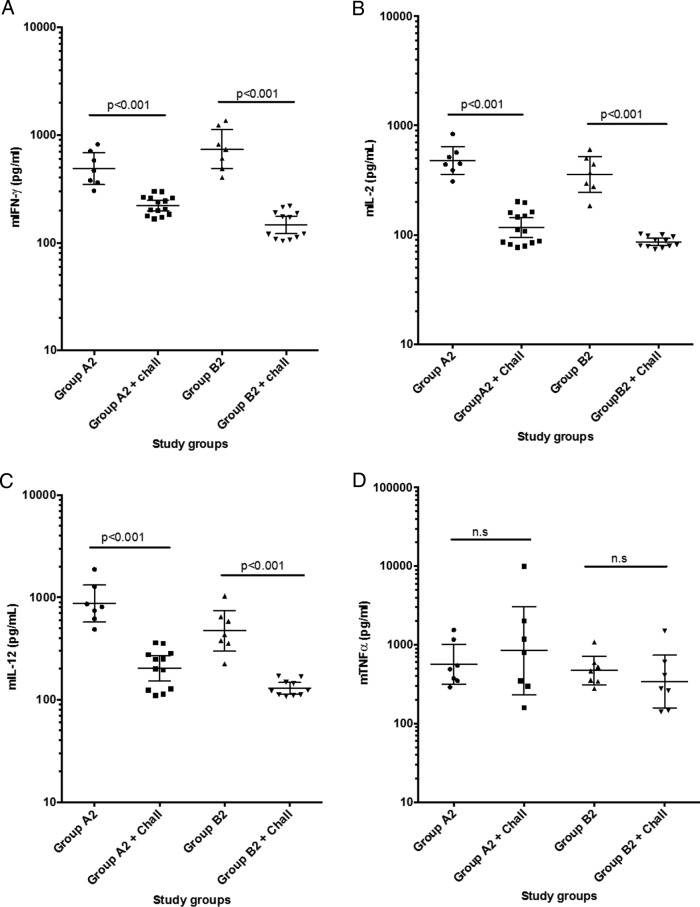
FIG 5.
Comparison of cytokine patterns prior to and postchallenge in groups A and B. In panels A to D, the cytokine patterns of four Th1-type biomarkers are compared pre- and postchallenge; data are geometric means (95% confidence intervals). In panels E to H, the cytokine patterns of four Th2-type biomarkers are compared pre- and postchallenge; data are geometric means (95% confidence intervals).

