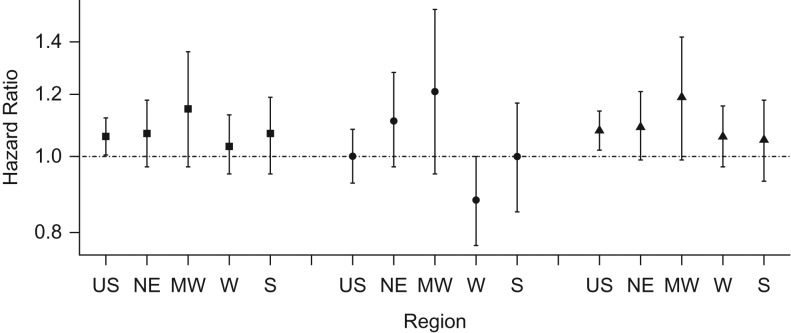
Figure 1.
Adjusted hazard ratios and 95% confidence intervals per 10-parts-per-billion increase in ozone exposures across the United States and by region, Nurses’ Health Study, 1996–2008. Square: antidepressant use or doctor diagnosis; circle: doctor diagnosis only; triangle: antidepressant use only. MW, Midwest; NE, Northeast; S, South; US, United States; W, West.

