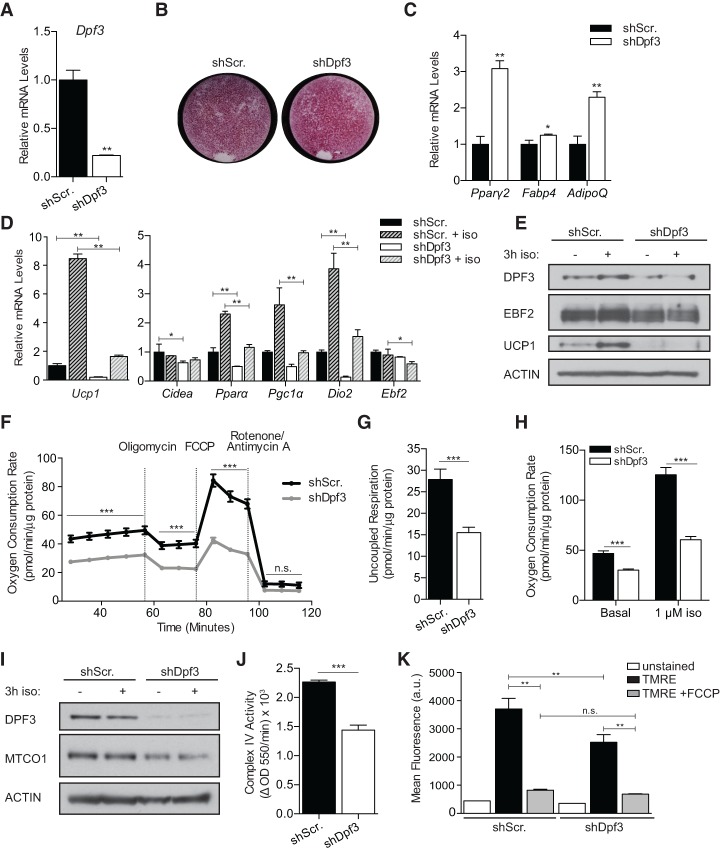
Figure 3.
DPF3 is required for activation of the brown fat program and mitochondrial function. (A) RT-qPCR analysis of day 7 mature brown adipocytes following shRNA-mediated Dpf3 depletion. (B) Oil-Red-O staining of shScr (control) and shDpf3 brown adipocytes. (C) RT-qPCR analysis of pan-adipogenic gene expression in control and DPF3-depleted mature brown adipocytes. (D) RT-qPCR analysis of brown fat-specific gene expression in control and DPF3-depleted mature brown adipocytes basally or following 3 h of stimulation with 1 µM iso. Mean ± SD. n = 3. Two-way ANOVA with Holm-Šídák multiple tests correction comparing shScr versus shDpf3 under basal or iso-stimlated conditions, (*) P < 0.05; (**) P < 0.01. (E) Western blot analysis of DPF3, EBF2, UCP1, and Actin (loading control) in control and DPF3-depleted brown adipocytes. (F) Oxygen consumption rate (OCR) in control and DPF3-depleted brown adipocytes; OCR was normalized to protein concentration. Mean ± SE. n = 23. Two-sample Student's t-test with Holm-Šídák multiple tests correction, (***) P < 0.001. (G) Uncoupled respiration in control and DPF3-depleted cells; OCR was normalized to protein concentration. Mean ± SE. n = 23. Two-sample Student's t-test, (***) P < 0.001 (H) OCR after acute iso stimulation in control and DPF3-depleted cells; OCR was normalized to protein concentration. Mean ± SE. n = 23. Two-sample Student's t-test, (***) P < 0.001. (I) Western blot analysis of DPF3, MTCO1, and Actin (loading control) in control and DPF3-depleted brown adipocytes. (J) Quantification of complex IV activity in control and DPF3-depleted brown adipocytes. Mean ± SE. n = 6. Two-sample Student's t-test, (***) P < 0.001. (K) Mean TMRE fluorescence assessed by flow cytometry in control and DPF3-depleted brown adipocytes. n = 3; 200,000 events recorded per sample. One-way ANOVA with Holm-Šídák correction for multiple comparisons, (**) P < 0.01.

