Figure 5.
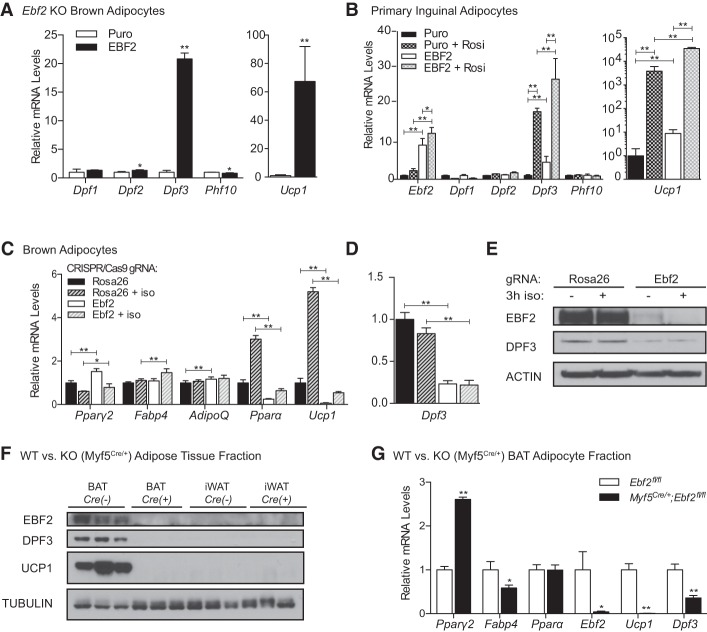
EBF2 transcriptionally regulates Dpf3 expression. (A) RT-qPCR analysis of Ebf2−/− brown adipocytes following retroviral-mediated control (Puro) or EBF2 overexpression. (B) RT-qPCR analysis in primary inguinal adipocytes following retroviral-mediated control (Puro) or EBF2 overexpression with and without rosiglitazone included throughout differentiation. Mean ± SD. n = 3. To compare all groups in a pairwise fashion, data were analyzed using a two-way ANOVA with Holm-Šídák multiple tests correction, (*) P < 0.05; (**) P < 0.01. (C) RT-qPCR analysis following CRISPR-mediated gene knockout in control (Rosa26) and Ebf2 knockout mature brown adipocytes basally or following 3 h of stimulation with 1 µM iso. Two-way ANOVA with Holm-Šídák multiple tests correction comparing shScr versus shDpf3 under basal or iso-stimulated conditions, (*) P < 0.05; (**) P < 0.01. (D) RT-qPCR analysis of Dpf3 expression in control and Ebf2 knockout mature brown adipocytes basally or following 3 h of stimulation with 1 µM iso. Mean ± SD. n = 3. Two-way ANOVA with Holm-Šídák multiple tests correction comparing shScr versus shDpf3 under basal or iso-stimulated conditions, (**) P < 0.01. (E) Western blot analysis for EBF2, DPF3, and Actin (loading control) in control and Ebf2 knockout brown adipocytes. (F) Western blot analysis for EBF2, DPF3, UCP1, and Tubulin (loading control) in wild-type (Ebf2fl/fl) or knockout (Myf5Cre/+;Ebf2fl/fl) BAT and iWAT. (G) RT-qPCR analysis of the mature adipocyte fraction from wild-type (Ebf2fl/fl) or knockout (Myf5Cre/+;Ebf2fl/fl) animals. n = 3 animals pooled per genotype. Error bars show SD of technical replicates. Two-sample Student's t-test, (*) P < 0.05, (**) P < 0.01.

