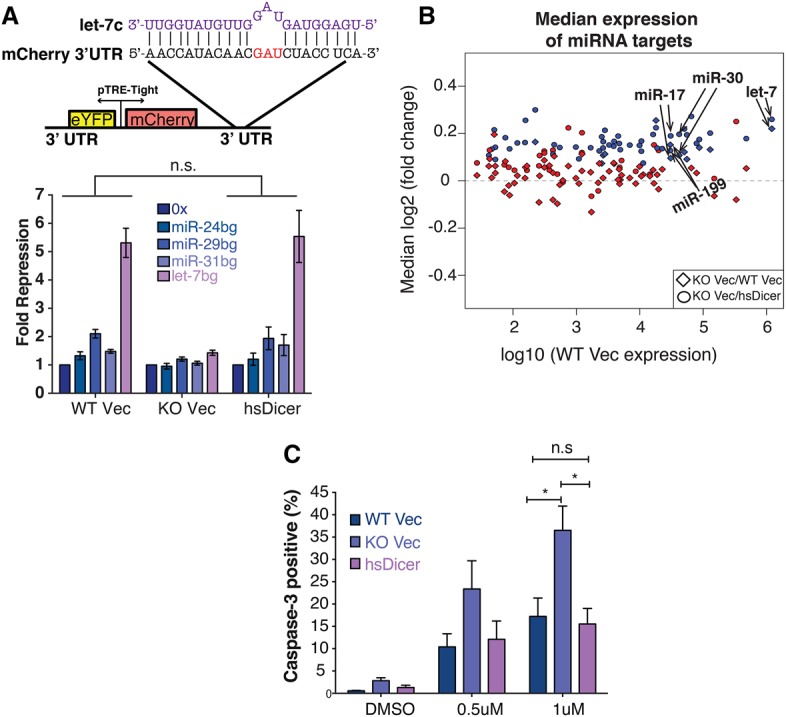
Figure 2.

hsDicer expression recovers miRNA activity. (A, top panel) Schematic of the dual-color reporter used to assay miRNA repression. The 3′ UTR of mCherry contains sites imperfectly complementary to the miRNA of interest. The let-7c sequence is shown in purple. (Bottom panel) After transfecting with the reporter, flow cytometry was used to measure mCherry and eYFP levels. For each cell type, fold repression is relative to the nontargeted 0x reporter. Data shown are the mean and standard deviation of three independent experiments. P-values were calculated by paired Student's t-test. (B) Scatter plot of the median change in expression of miRNA targets relative to control genes matched for 3′ UTR length, GC content, and expression. Each point represents conserved targets of a single TargetScan miRNA family. miRNA expression is based on the average wild-type Vec expression reported in this study. Only expressed miRNAs are shown. (Blue) Significant change (Wilcoxon rank sum P ≤ 0.05); (red) not significant. (C) Doxorubicin-induced apoptosis measured by caspase-3 cleavage. The mean ± SEM of three independent experiments is indicated. P-values were calculated by unpaired Students t-test. (*) P < 0.05; (n.s) not significant.
