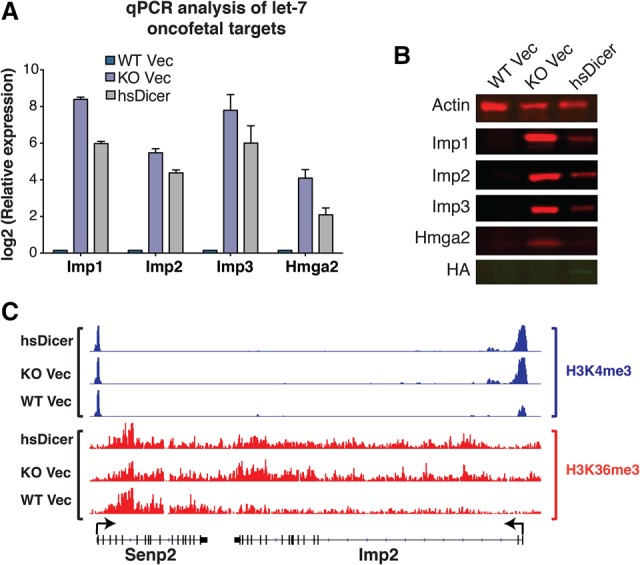
Figure 3.

Despite miRNA rescue, let-7 oncofetal targets remain activated. (A) qPCR analysis of four let-7-regulated oncofetal genes. Note the logarithmic scale. For each gene, expression is relative to wild-type Vec levels. Data are plotted as the mean ± SEM of four or more independent experiments. (B) Western blot analysis of the oncofetal gene set. HA tag was used to indicate hsDicer expression. Actin was used as a loading control. (C) Normalized read counts for H3K4me3 and H3K36me3 marks at the Imp2 locus across the three cell lines. Within each chromatin mark, all conditions are set to the same scale. Flanking genes are shown as controls. Arrows indicate transcription start sites (TSSs).
