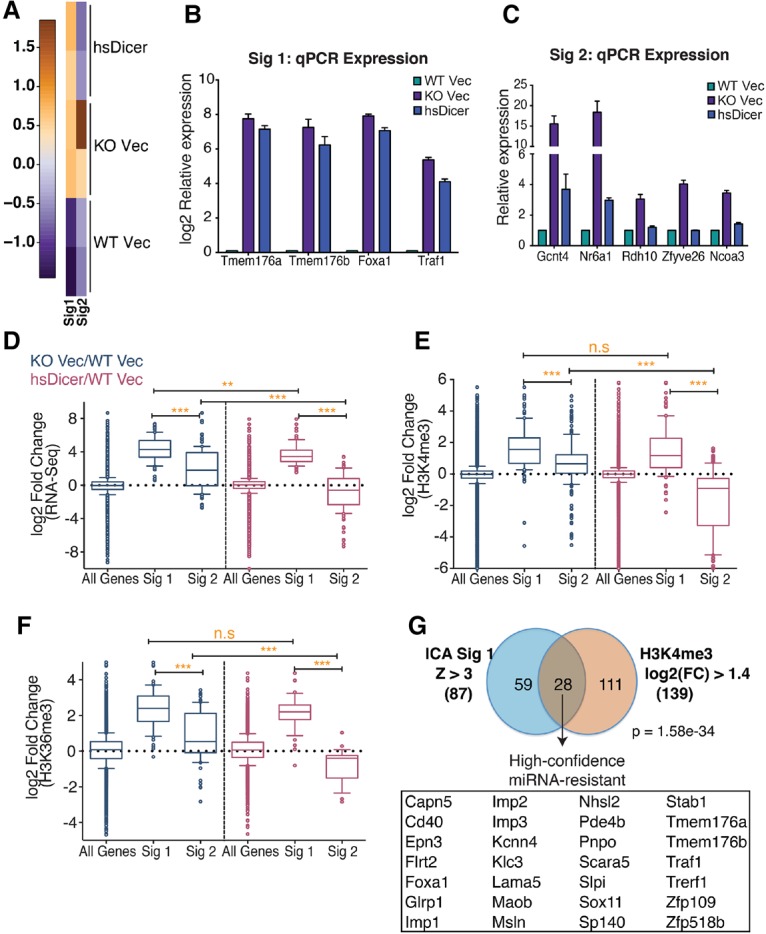
Figure 4.

Identification of a high-confidence miRNA-resistant gene signature. (A) Heat map depicting two independent, statistically significant gene signatures detected in the RNA-seq expression data set using ICA. Signature 1 (Sig1) represents an expression pattern of genes up-regulated in knockout Vec and hsDicer conditions relative to wild-type Vec. Signature 2 (Sig2) represents genes that are down-regulated to wild-type Vec levels upon introduction of hsDicer. (B,C) qPCR validation of “irreversible” or “miRNA-resistant” genes identified from signature 1 (B) and “reversible” or “miRNA-sensitive” genes identified from signature 2 (C). Results are plotted relative to wild-type Vec levels. Bars represent mean ± SEM of at least three independent experiments. (D) Box and whisker plots of normalized RNA-seq expression fold changes for all expressed genes (n = 12834), signature 1-correlated genes (n = 87), and signature 2-correlated genes (n = 112). (E,F) Same as in D but for fold changes in normalized counts for gene-associated H3K4me3 peaks (E) and H3K36me3 peaks (F). Whiskers represent the 10th–90th percentile, and all other points are shown as individual dots. The P-values were calculated by Mann-Whitney U-test. (**) P < 0.01; (***) P < 0.0001; (n.s) not significant. (G) Overlap of signature 1-correlated genes and genes with a log2 fold change of at least 1.4 in H3K4me3 peak counts near their TSSs. The H3K4me3 criteria is satisfied by both knockout Vec/wild-type Vec and hsDicer/wild-type Vec comparisons. High-confidence miRNA-resistant genes are listed. The hypergeometric test's P-value is indicated.
