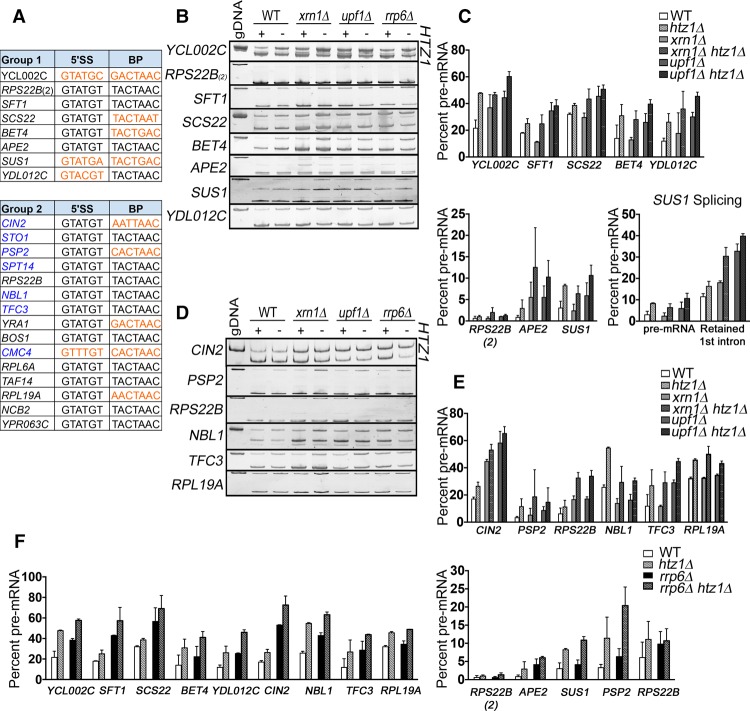
Figure 3.
RT–PCR analysis confirms that genes with nonconsensus splice sites are particularly sensitive to loss of H2A.Z. (A) Group 1 consists of ICGs whose splicing decreases by ≥10% in the wild-type, xrn1Δ, and upf1Δ backgrounds. Group 2 consists of ICGs whose splicing decreases by ≥10% in the xrn1Δ and upf1Δ backgrounds. Genes that did not pass the minimum-read filter in the wild-type background are denoted in blue. Nonconsensus splice sites are denoted in orange. (RPS22B) 5′ untranslated region (UTR) intron; (RPS22B_2) coding region intron. (B) Analysis of group 1 genes by RT–PCR in wild-type, xrn1Δ, and upf1Δ cells ±HTZ1. Products were analyzed on 6% PAGE gels (8% for SUS1). Pre-mRNA size is indicated by genomic DNA size. (C) Quantification of group 1 RT–PCR unspliced (pre-mRNA) products. (Bottom right) Quantification of SUS1 pre-mRNA and splicing intermediate containing only the second SUS1 intron. (D) Analysis of group 2 genes by RT–PCR in wild-type, xrn1Δ, and upf1Δ cells ±HTZ1. Products were analyzed on 6% PAGE gels. Pre-mRNA size is indicated by genomic DNA size. (E) Quantification of group 2 RT–PCR unspliced products. (F) Quantification of group 1 and group 2 RT–PCR unspliced products in rrp6Δ cells ±HTZ1. Quantification graphs represent the average of two independent experiments, and error bars represent the standard deviation (SD). (gDNA) Genomic DNA.

