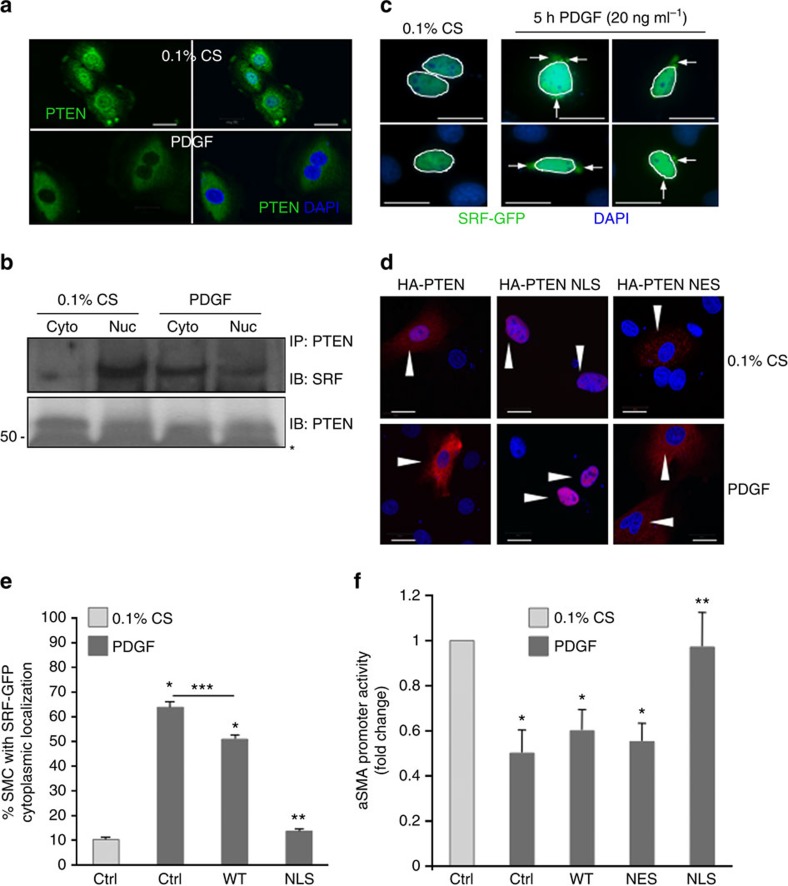
Figure 7. Nuclear PTEN blocks PDGF-mediated repression of SM gene transcription.
(a,b) SMCs were serum-restricted for 48 h followed by stimulation with vehicle control or 20 ng ml−1 PDGF-BB for 24 h (a) or 48 h (b). (a) SMCs were fixed, immunofluorescently stained for PTEN (green) and analysed for PTEN localization using confocal microscopy; nuclei were stained for DAPI (blue). (b) PTEN was immunoprecipitated (IP) from cytoplasmic (cyto) and nuclear (nuc) fractions of vehicle- or PDGF-stimulated SMCs. Co-immunoprecipitating SRF was detected by immunoblotting (IB). Representative western blot from three separate experiments. (c) SMCs were transfected with a construct expressing SRF–GFP, maintained in serum-restricted conditions or stimulated with 20 ng ml−1 PDGF-BB, fixed and analysed for GFP localization; nuclei were stained for DAPI (blue). Shown are representative images (two serum-restricted and four PDGF-stimulated cells are shown); arrows indicate cytoplasmic localized SRF–GFP; nuclei are outlined with white lines. (d) SMCs were transfected with HA-tagged wild-type PTEN (WT), nuclear localized PTEN (NLS) or nuclear excluded PTEN (NES). SMCs were maintained in serum-restricted conditions or stimulated with 20 ng ml−1 PDGF-BB, fixed, immunofluorescently stained for HA (red) and analysed for PTEN localization; nuclei were stained for DAPI (blue). Arrowheads, HA–PTEN-transfected SMCs. (e) SMCs were transfected with GFP–SRF (ctrl) or co-transfected with GFP–SRF and WT PTEN or nuclear localized PTEN (NLS) then maintained in serum-restricted conditions or stimulated with 20 ng ml−1 PDGF-BB. Transfected SMCs exhibiting cytoplasmic GFP expression were scored as described in Methods. Data represent average per cent positive±s.e.m. N=3 independent experiments; *P<0.01 versus control 0.1% CS; **P<0.01 versus control PDGF and WT PTEN PDGF; ***P<0.01 versus control PDGF. (f) Non-transfected (Ctrl) and HA–PTEN-transfected SMCs were co-transfected with an Acta2 promoter-Luciferase reporter construct. SMCs were serum-restricted for 48 h followed by stimulation with vehicle control or 20 ng ml−1 PDGF-BB for an additional 24 h. Luciferase activity normalized to β-galactosidase was determined; shown are fold changes from Ctrl serum-restricted (0.1% CS) SMCs. Data represent average fold changes±s.e.m. N=3 independent experiments; *P<0.01 versus Ctrl 0.1% CS; **P<0.01 versus Ctrl PDGF. Molecular weight markers were cropped out for final SRF blot; please see Supplementary Fig. 8. Scale bars for all images, 20 μm.

