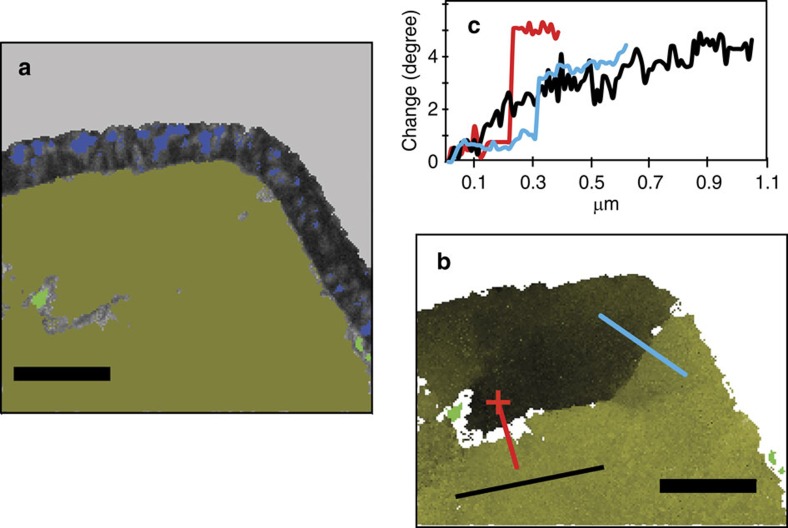
Figure 2. Pyrrhotite analysis.
(a) Forescatter electron image overlain by a phase map highlighting the polycrystalline magnetite corona (blue) and two chalcopyrite exsolutions (light green) within pyrrhotite. (b) Pyrrhotite inclusion without the magnetite rim (see light green chalcopyrite for orientation), highlighting the relative change in crystallographic orientation within the pyrrhotite by a change of green hues across the inclusion. The lines (red and blue across a subgrain boundary, black within grain) indicate profiles for the quantified orientation change of up to 5° as plotted in (c). Scale bar, 0.5 μm.

