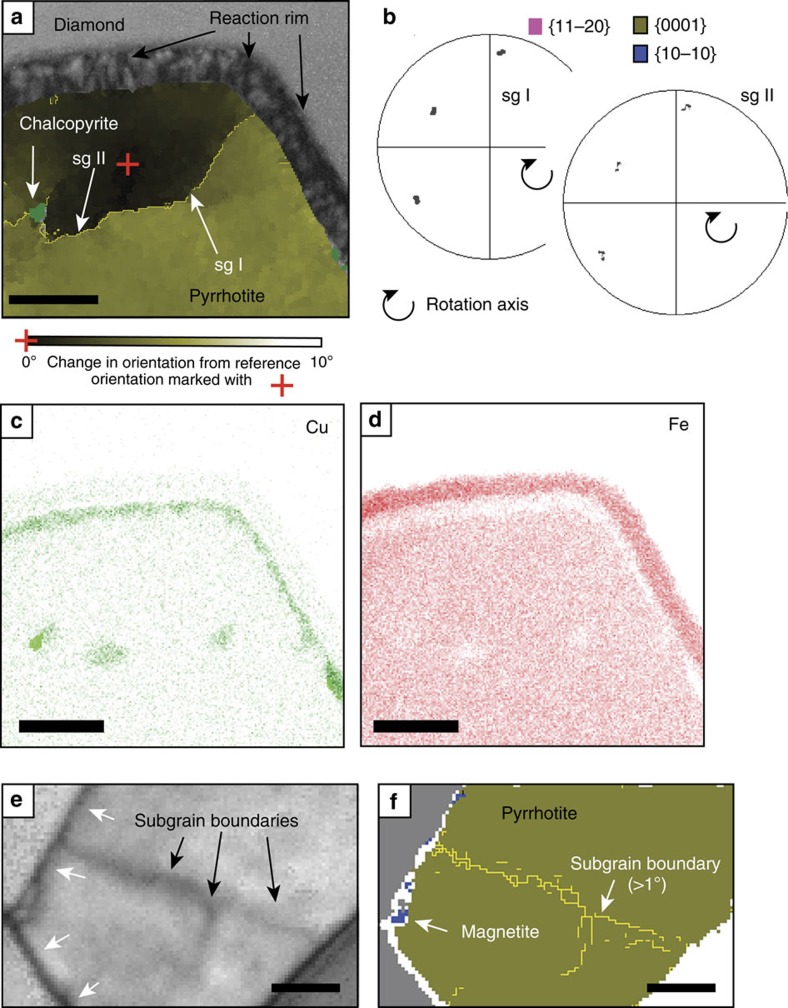
Figure 3. Detailed microstructure of the inclusions.
(a) Microstructure of inclusion 1 with subgrain boundaries (sg I, sg II). (b) Pole figures of dispersion patterns of subgrain boundaries in sulfide are indicative of plastic deformation. The ‘boundary trace analysis' technique33 was used to determine the activated slip system, which is consistent with dispersion patterns across subgrain boundaries. (c,d) Element distribution maps for Cu and Fe across the pyrrhotite show distinctive Cu enrichment, and correlated Fe depletion, where chalcopyrite inclusions were identified and an area of Cu enrichment along the rim of the pyrrhotite. (e,f) The magnetite on the outside of inclusion 2 is only very small. Scale bar: (a,c,d) 0.5 μm; (e,f) 0.2 μm.

