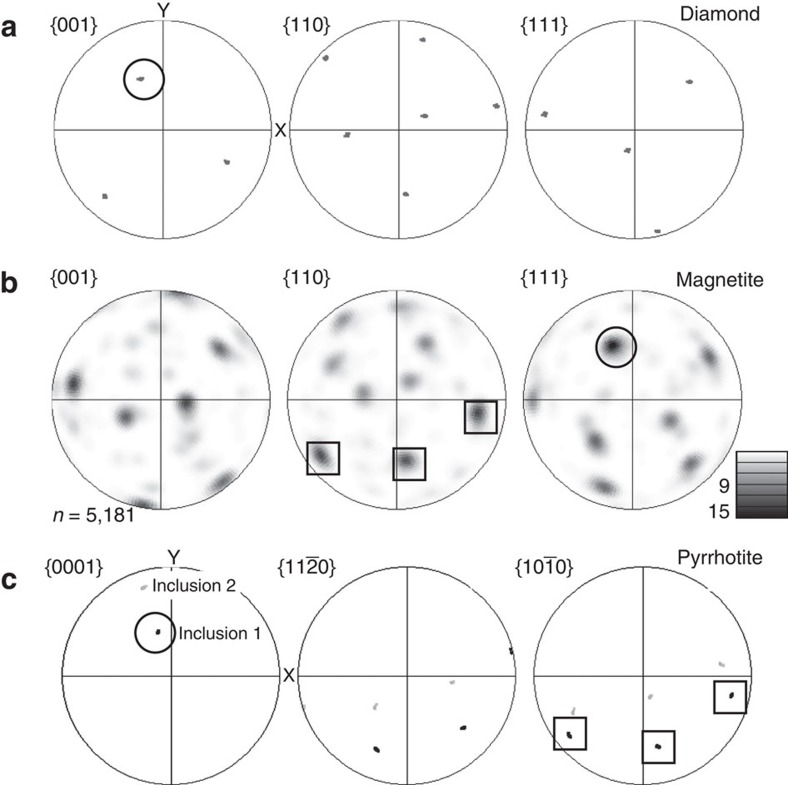
Figure 4. Pole figures showing orientation relationships.
Circles depict the epitaxy between one <001> axis of diamond (a), the <0001> axis of pyrrhotite in inclusion 1 (c) and one of the magnetite <111> axes (b). Squares denote the epitaxy between magnetite and pyrrhotite in inclusion 1. One of the {111} axes of magnetite (5181 datapoints) correlates with the {001} axis of inclusion 1 and the crystallographic {001} axis of the host diamond. Pyrrhotite in inclusion 2 (c) shows no epitaxy with the host diamond (a).

