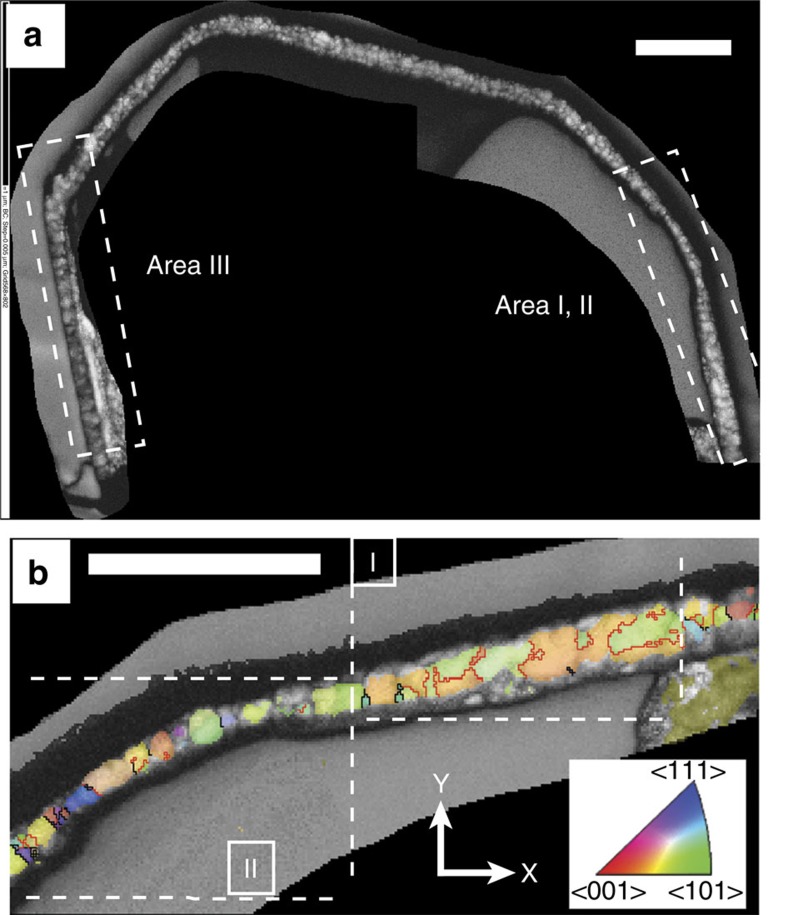
Figure 5. Crystallographic analysis of the magnetite corona.
(a) Forescatter electron image of the re-thinned magnetite corona. Pyrrhotite was lost during re-thinning. The crystallography of Areas I, II and III was further analysed. (b) Crystal preferred orientation of magnetite in Areas I and II, colour-coded according to the legend and the reference frame (bottom right). Grain boundaries are in black, red lines are twin boundaries. (a,b) Scale bar, 0.5 μm.

