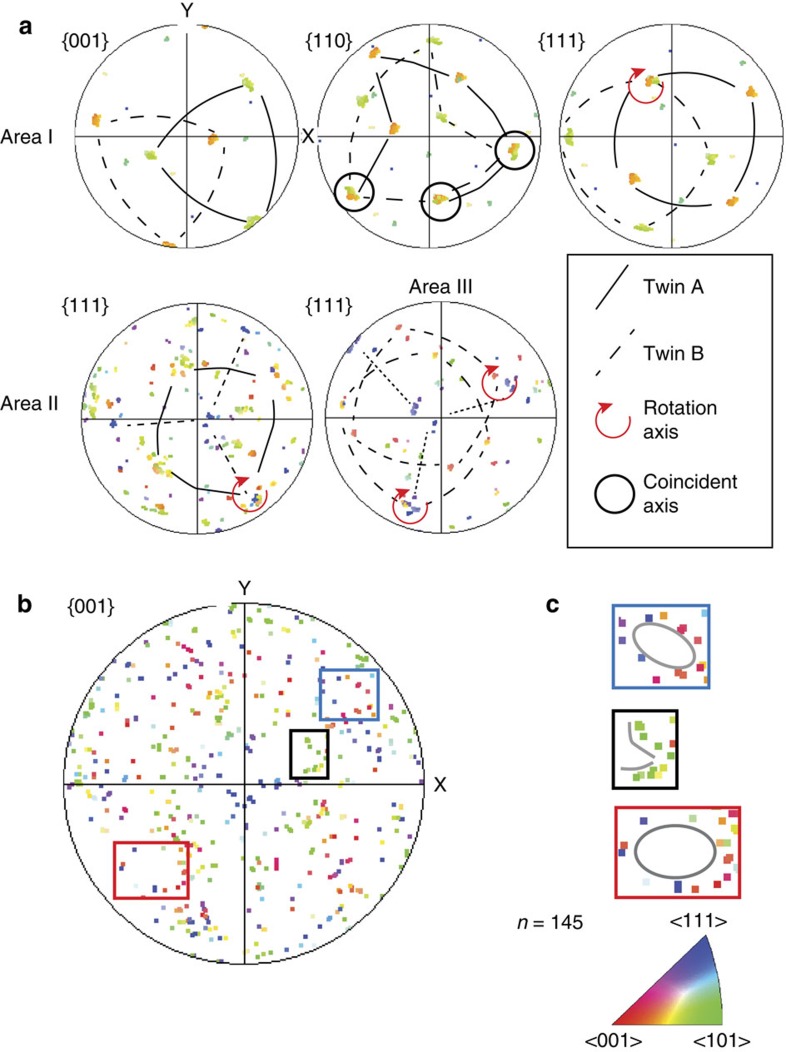
Figure 6. Crystallographic analysis of the magnetite corona.
(a) Pole figures for Areas I, II, III from Fig. 5. Each domain is dominated by two orientations with a twinning relationship rotated by 60° around <111>. Up to 3 <110> axes coincide between the twins. (b) Magnetite data set for all three areas of the corona (167 data points, one point per grain) showing distinctive non-random distribution with empty areas (some are marked by squares). (c) Enlargement of the squared areas shows alignment of orientations in the form of ‘rings' (blue and red square) and ‘fences' (black square).

