
Figure 4.
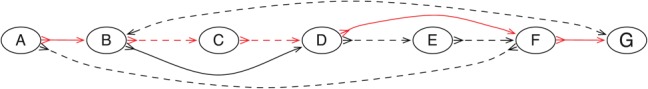
A pangenome ordering on a graph constructed from two genomes. The red edges indicate the path of the pangenome through the graph. The solid and dotted edges indicate the adjacencies between nodes in the two source genomes. (Adapted from Nguyen et al. 2015, with permission from the author.)